Application Note: Analysis of Iron Oxidation States by XPS
X-ray photoelectron spectroscopy (XPS ; also known as ESCA—electron spectroscopy for chemical analysis) is a surface analysis technique in which a solid surface in a vacuum is irradiated with x-rays to produce photoelectrons by direct transfer of energy from the x-ray photons to core-level electrons in the atoms of the sample. The photoelectrons that are emitted are collected and energy analyzed to produce an electron energy spectrum. The energy of the photoelectrons is related to the atomic and molecular characteristics of the sample, whereas the number of photoelectrons emitted is related to the concentration of the emitting atom in the sample.
The mean free path of XPS photoelectrons in solids is only a few nanometers, so the photoelectrons that are analyzed originate from the outermost 1-10 nm of the sample. This is the basis of the surface sensitivity of XPS.
The spectrum of photoelectron energies contains peaks characteristic of the elements present on the sample. The energy of photoelectron peaks is commonly expressed as binding energy, which is the energy required to remove a photoelectron from an atom. Binding energies are usually reported in units of electron volts (eV).
At high energy resolution, shifts in photoelectron peak position and structure are observed for atoms in different chemical states. These shifts are produced by ionic and covalent bond differences between atoms. Chemical shifts can be used to distinguish the oxidation state of transition metals.
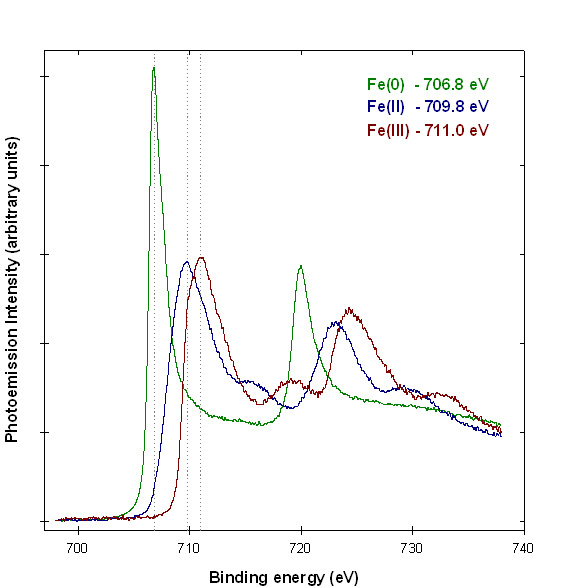
Figure 1 shows examples of iron XPS spectra from reference compounds. The Fe (0) standard was measured from an iron foil cleaned by argon ion sputtering. The Fe (II) standard was produced by heating an iron oxide film under vacuum.1 The Fe (III) standard was measured from Fe2O3 powder.2
The spectra exhibit a variety of structure due to initial and final state effects, including chemical shifts, asymmetric peaks, spin-orbit coupling, multiplet splitting and shake-up satellites. Peak fitting can be performed on spectra of mixtures of iron oxidation states, but the use of analytic functions for the peaks can be complex and result in highly correlated parameters.
An alternative approach to fitting complex transition metal XPS spectra is to use spectra from standards as the basis functions for linear peak fitting. This approach avoids having to describe the peak shapes analytically. The main disadvantage is that oxidation state standards can be difficult to prepare, especially for surface analysis were the outermost layers can be more oxidized than the bulk of the material.
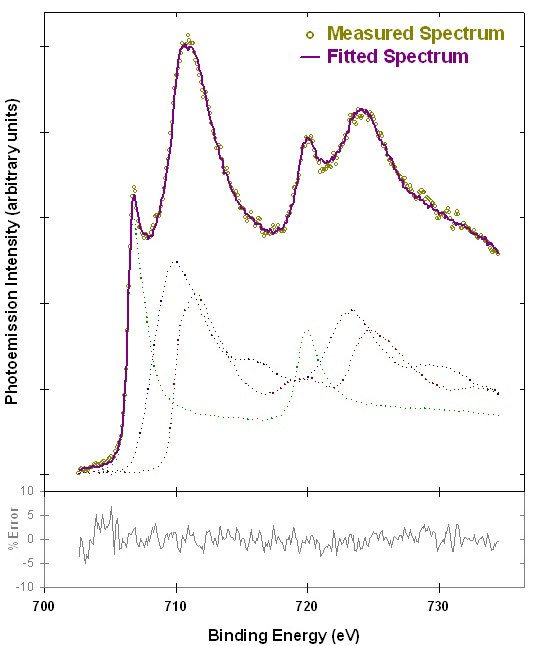
Figure 2 shows an example linear peak fit of a mixed iron oxidation state sample. The measured spectrum is well fit by a linear combination of the reference spectra from Figure 1. Inelastic backgrounds were removed using the Tougaard method.3 The fit result indicates that the spectrum contains 28±2% Fe(0), 41±5% Fe(II), and 32±6% Fe(III).
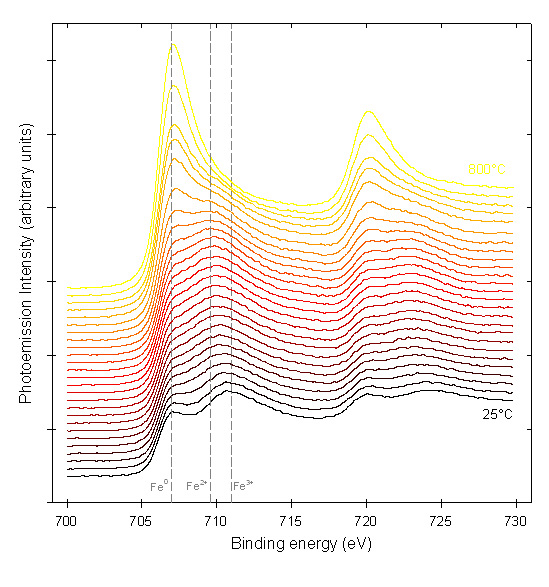
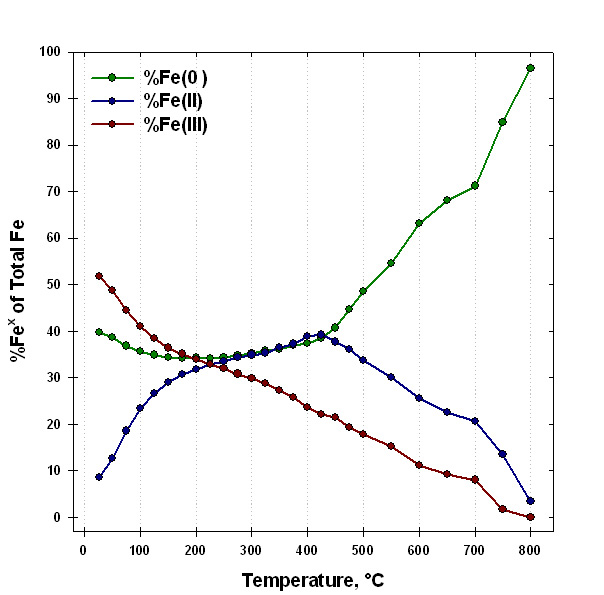
The use of iron oxidation state analysis is illustrated by the example shown in Figures 3 and 4. An Fe (110) single crystal was oxidized in a vacuum chamber with ~4,000 L of pure oxygen, then heated to 800°C while collecting XPS spectra.4 The changes in peak position and structure indicate that the oxide film undergoes oxidation state changes throughout the heating, and eventually is almost completely reduced to iron metal. In Figure 4, the relative proportions of iron oxidation states are plotted as a function of heating temperature.
Transition metal oxidation state analysis by XPS has been used in the study of corrosion, catalysis, lubrication, and other industrial applications. However, these studies are best performed on samples in situ, since exposure to air will oxidize most of the surface iron atoms to Fe (III).
References
1. M. Oku and K. Hirokawa, J. Appl. Phys. 50(10), 6303 (1979).
2. Iron (III) oxide, grade 99.9995+%, Alfa Aesar.
3. P.M.A. Sherwood, in Practical Surface Analysis, Second Edition, Volume 1-Auger and X-ray Photoelectron Spectroscopy, Wiley, Chichester, UK (1990).
4. K. Rhodes, Ph.D. Thesis, Northwestern University, Evanston, Illinois (1990).
Comments
add comment