Advantages of Semi-Autonomous Microscopy-Based Particle Size and Shape Characterization
Particles, powders, and colloidal suspensions have found wide-ranging applications in many medical, pharmaceutical, technological, food, and beauty products in the 21st century, and their future efficacy is only expected to improve. Materials characterization of individual particles can sometimes be a challenge, even with dedicated instrumentation developed for specific measurements. One particularly important characteristic of a powder sample is its particle size distribution (PSD). Since many extrinsic material properties are particle size dependent, it is a necessity to accurately determine the PSD of a powder or colloidal suspension to fully understand and predict its function in a specific application.
Many suitable methods have been developed to for making particle size measurements. One approach involves analysis of an optical property of matter that is particle size dependent. Examples of this type of analysis include laser or X-ray diffraction, dynamic light scattering, and spatial filter velocimetry. These methods are great for a quick look at PSDs of large ensembles of particles, but often require an ideal sample to provide accurate measurements. An ideal sample remains stable during the measurement process, disperses easily as individual particles, is insoluble in the process medium, and has particle dimensions within a range appropriate for the method used.
McCrone Associates offers a solution that is grounded in microscopy and depends on image analysis methods that can be customized to fit almost any type of powder or colloidal suspension. Our approach is a semi-autonomous method in which the sample preparation and microscopy are manual, but the particle measurement and counting is automated through batch image processing techniques. This method is highly customizable, which provides accurate solutions for end cases, outlier samples, and other samples that do not fit into the tight parameters of dedicated sizing instruments. These may include:
- Samples that are difficult to prepare
- Particles with high aspect ratios or complex morphologies
- Samples that readily aggregate
- Samples outside rated size limits
McCrone Associates is well equipped to optimize the image-based PSD measurement procedure. Our experience regarding sample preparation and microscopy solutions, coupled with recent advancements in image analysis software, makes accurate sizing faster and more comprehensive. One example of this is achieving the required number of particle measurements to generate useful results. The number of particles statistically required for accurate analysis varies on a case-by-case basis, but it can range from a few hundred to several thousand particles. Semi-autonomous particle size measurement methods, such as batch image thresholding, can boost the particle ensemble up to the statistical numbers required while also reducing the amount of time needed to conduct the analysis.
Figure 1 illustrates the process of obtaining a PSD from images captured with a microscope of square-shaped particles. From top to bottom, examples using the three main types of microscopes that we use are given: light microscopy (top), scanning electron microscopy (middle), and transmission electron microscopy (bottom). From left to right, a raw image is shown, followed by the results of the image thresholding routine applied to the set of images to distinguish particles from substrate, and the resulting PSD from the individual particle measurements. Samples (A) and (B) were dark squares produced on a lithographed reference material. Sample (C) was a dispersion of FeCo core-shell nanoparticles with cuboid shapes. This highlights a major advantage of the image-based method, which allows for the inspection of the particles themselves side-by-side with the PSD results. This often reveals insights that are difficult to obtain without imaging.
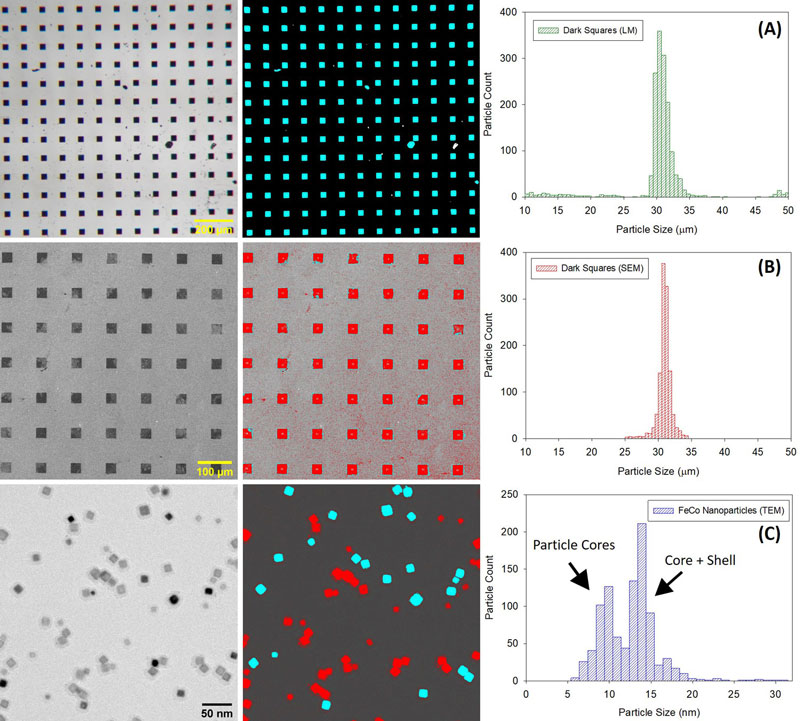
A good example of this is the bimodal size distribution observed in Figure 1(c). A bimodal size distribution was unexpected for this sample, but the TEM imaging revealed that it was a consequence of the core-shell structure. Sometimes the particles are oriented in such a way that the shell is included in the size measurement, and other times the shell is not included. Precision thresholding can more accurately distinguish the core-only PSD from the core-shell PSD. This illustrates the value in being able to see the particles, because the initial size distribution was misleading. Fortunately, the error was discovered when the results were compared to the images.
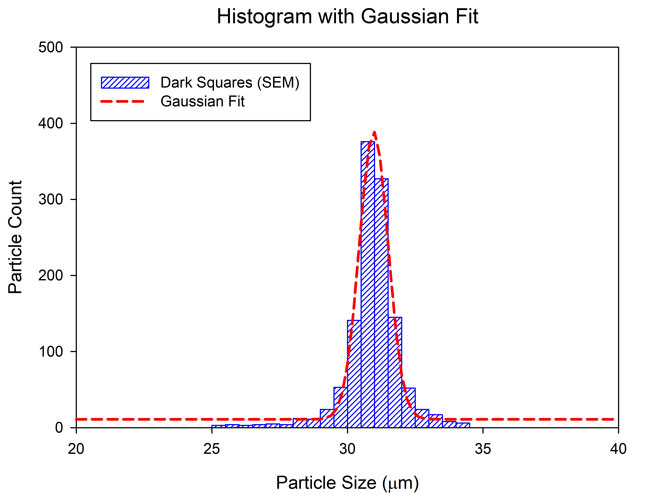
In certain cases, the statistically required number of particles for accurate size measurements is not realistically attainable. In these situations, it is appropriate to use peak fitting methods to model the size distribution using a suitable function (Figure 2). This provides better estimates for the standard descriptive values (i.e. mean, standard deviation, and mode) because the size distribution’s shape is accounted for and used to weight these values. This achieves greater accuracy when a large number of measurements is unattainable.
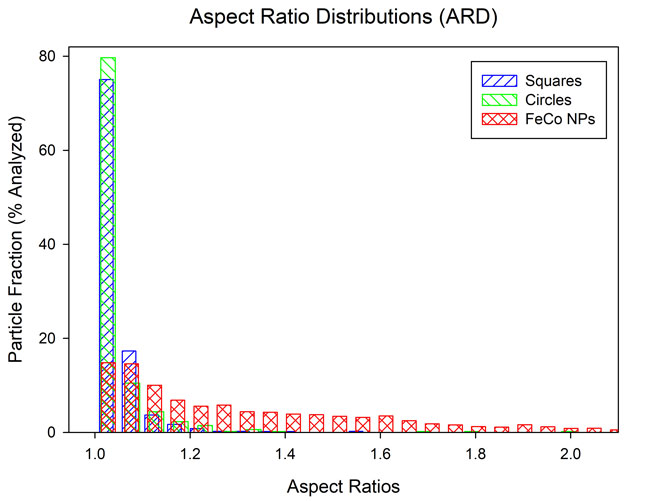
There is a lot of value in quantifying and visualizing the consistency of particle shapes in a powder or suspension. Size is often derived from the cross-sectional area or projected area of a particle—this is often called the projected area diameter, but many other parameters can be obtained using more advanced procedures. For example, fitting an ellipse to a particle gives the major and minor axes of the ellipse, from which the particle’s aspect ratio and roundness can be calculated. Histograms of aspect ratio can then be used to characterize and make comparisons between the aspect ratio distributions (ARD) of various samples (Figure 3).
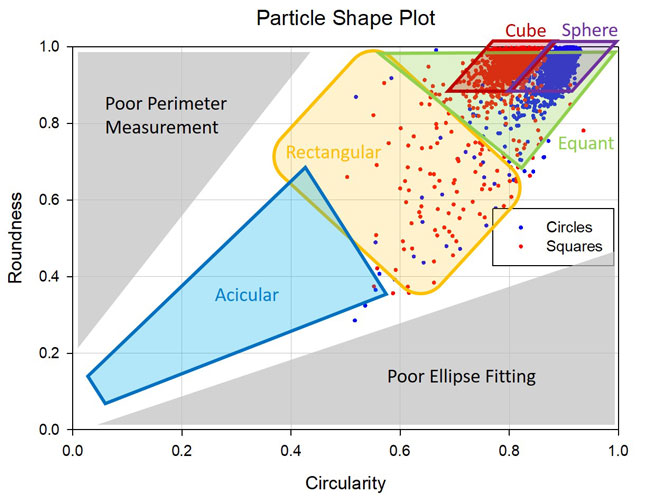
Lastly, a particle shape plot can be produced by plotting circularity on the x-axis and roundness on the y-axis (Figure 4). Since roundness is defined as the inverse of aspect ratio, a roundness value less than 0.5 corresponds to an aspect ratio greater than 2. This means that acicular particles will be found in the bottom half of the plot, and equant particles will be found in the top quarter of the plot. Since circularity is defined as 4π(area)⁄(perimeter)^2 , different shapes are also represented in specific regions of this plot. For example, rectangular (< 0.7), square (~ 0.8), and circular (1.0) particles will be positioned in the regions outlined in Figure 4. Finally, there are some dead zones to watch out for in the corners near (0, 1) and (1, 0). These arise because both circularity and roundness should decrease as aspect ratio increases. Therefore, points that reside in these regions may have been the result of poorly made measurements or image artefacts.
In summary, semi-autonomous batch image thresholding coupled with optical or electron microscopy is a powerful means of extracting valuable materials information, such as particle shape and distribution modality. The image-based, semi-autonomous method provides several checkpoints at which the analyst can evaluate the quality of the results, and make informed decisions about how to achieve the most representative size distribution for a given sample. Whether working in the nanoscale size regime using a TEM or with larger particles using an SEM or light microscope, the comprehensive analysis of particle sizes and shapes ensures a more complete understanding of a powder or suspension’s extrinsic properties.
Comments
add comment