Butterfly and Moth Scales
Overview
Butterfly and moth scales are complex, fragile, structures that cover the wing of the insect. To remain attached, each scale snaps into an individual pocket-like slot. The scales observed from the wings range in size from 30-80 µm x 30-500 µm. The scales do assist in flight, but some can be lost without a major effect to the insect’s ability to fly; scales are easily detachable to help free the wing if it is caught in a spider’s web (Barish 79). It is suspected that the scales’ structure is meant to help attract a mate, and also act as a predator deterrent due to the scales’ shape causing interference of light well into the UV range and possibly interfering with echolocation (Barish 79). The scales’ morphology is easily recognizable and can be identified using polarized light microscopy. Scanning electron microscopy and energy dispersive X-ray spectrometry are useful complementary techniques for the identification of butterfly and moth scales.
Polarized Light Microscopy
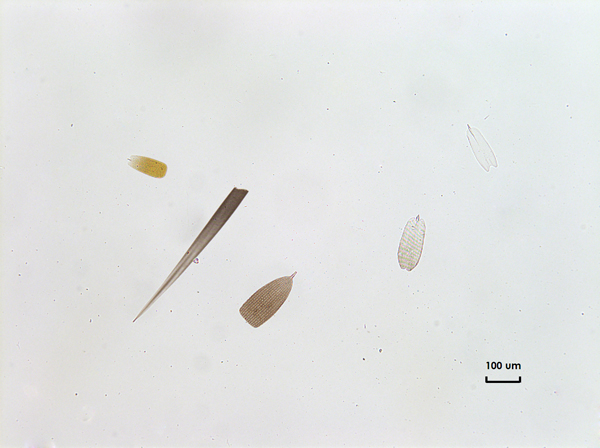
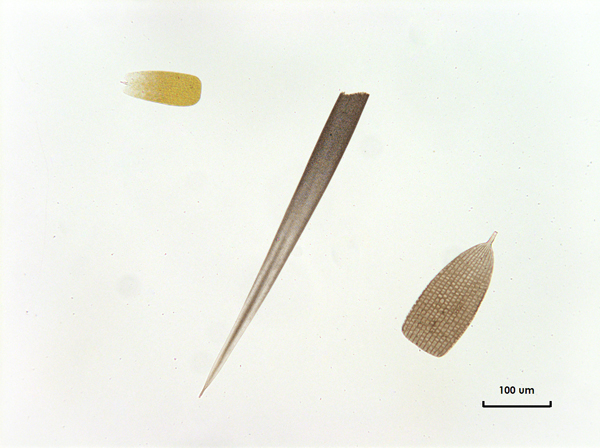
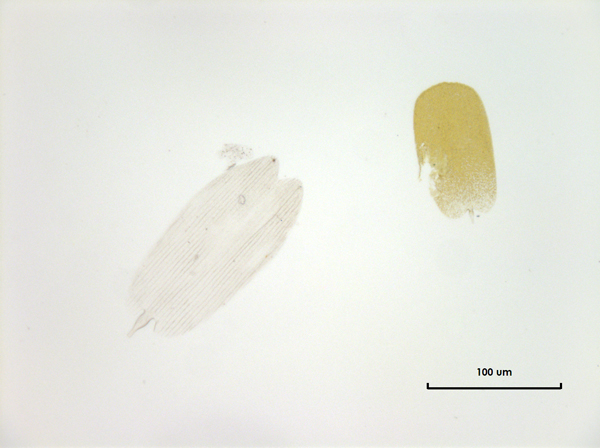
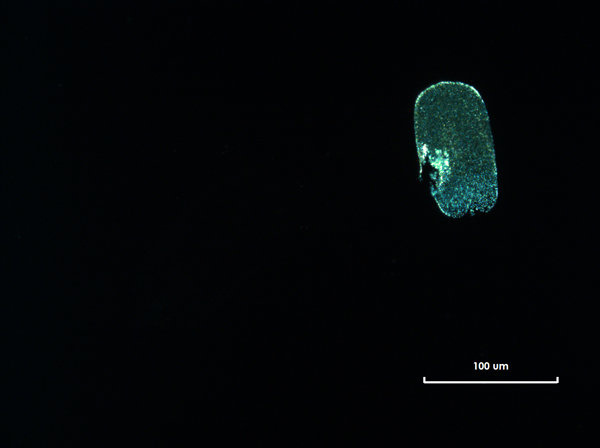
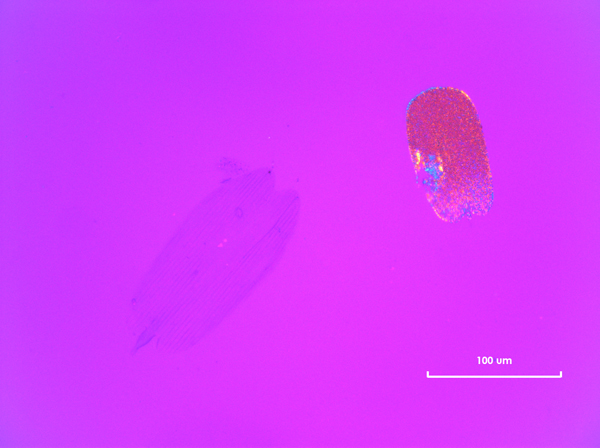
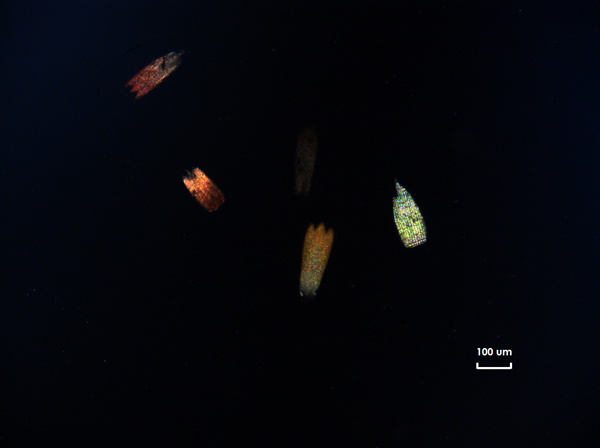
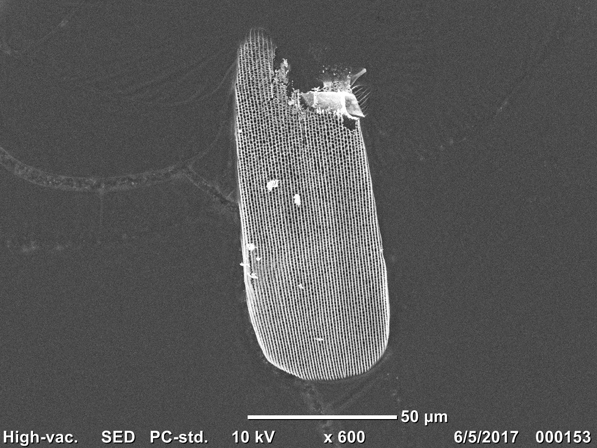
Scales occur in a variety of different shapes, but they are all thin and relatively flat (Figure P1-1). Some scales are short and wide, approximately 50 µm x 50 µm, while others are thin, long, and more ribbon-like, approximately 30 µm x 150 µm. Moths tend to have a larger quantity of the longer scales than butterflies. Some scales have a flat distal edge, while other scales are shaped similarly to duck feet and have anywhere from two to four points on the distal end. The wider and longer scales tend to have points; the shorter and slimmer ones do not. Scales vary in color, which can be due to structure or pigmentation (Figure P2-1). While most scales are isotropic, the yellow scales observed were anisotropic, but did not show extinction (Figures P3-1, P3-2, and P3-3). It is suspected that the anisotropy is due to pigmentation of the scale. Scales have a grainy side and a smooth side. The grainy side is considered the top, facing out on the wing. The grainy side of the scales have evenly-spaced ridges running along the length of the scale, while the smooth side of the scale is a thin transparent membrane (Teetsov 9). The refractive index of all the scales was found to be approximately 1.550 ± 0.0002. When viewed without refractive index liquid, the scales appear anisotropic (Figure P4-1). The sides of the scale have opposite signs of elongation, which shows that the structure of the scale can create a diffraction grating that can be used as a form of communication for butterflies, considering they can see well into the UV spectrum and distinguish polarization (Barish 85).
No fluorescence was observed with narrow-band 365 nm ultraviolet light.
Click on any image to view enlargements.
Tutorial
Micro-Art
Butterfly and moth scales can be used to make microscopic artwork. Handling the fragile scales requires patience. The tools and techniques for scale handling are found in the article “Butterflies and Art” by Anna Teetsov.
Scales on butterfly wings are fragile, but do not deteriorate; when making micro-art, the wings used for a source of scales can be old or new. A single butterfly or moth can contain many shapes and sizes of scales, and a reasonable range of colors to work with.
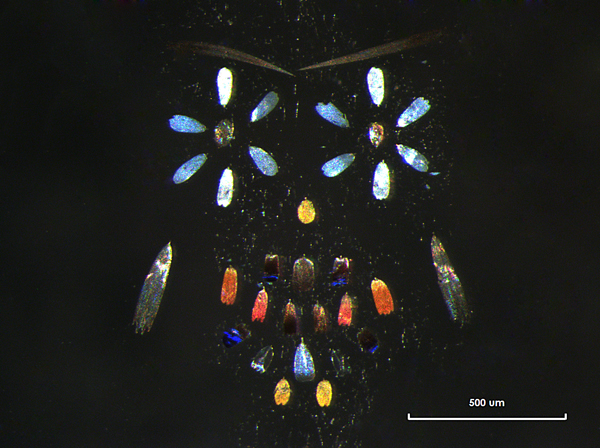
The scales were collected using tools described in the article: a scale remover, palette filters, and a flanged ball bearing rotating stage. After scales were collected, they were viewed using the stereomicroscope and picked for shape and color to create the figure of an owl (Figure P5-1). Scales were picked up using a flat tungsten needle and then carefully arranged on a round coverglass that had a thin adhesive film applied to it. The use of the rotating stage helped by keeping the scales and the coverglass in the same field of focus, and allowed for rotation of the coverglass, which aided in placement and orientation of the scales. This piece took close to three hours to complete and used 35 scales.
References
Barish, L. (1999) Mysteries of a Butterfly Wing. The Microscope, Vol. 47:2, 79-92.
Teetsov, A. S. (2002) Butterflies and Art. The Microscope, Vol 50:1, 9-19.
Instrumentation Used
- Olympus BX51-P
- Olympus SZX10
Scanning Electron Microscope (SEM)
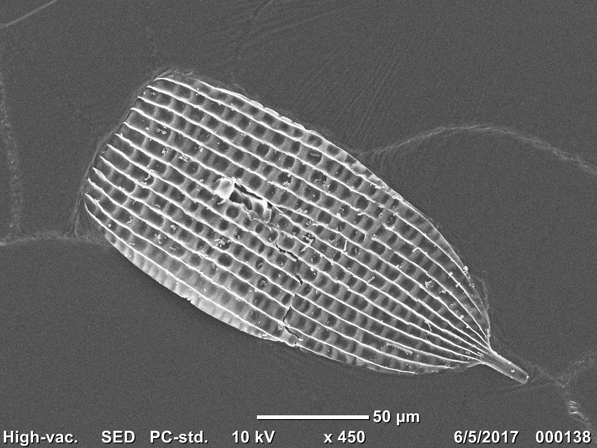
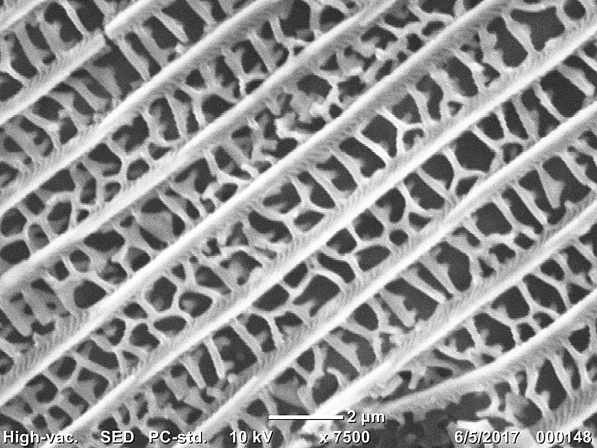
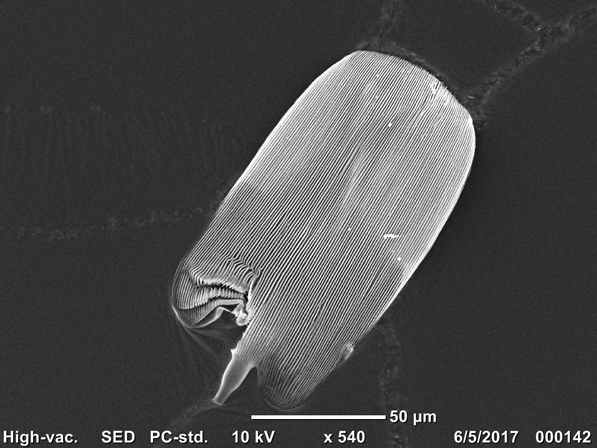
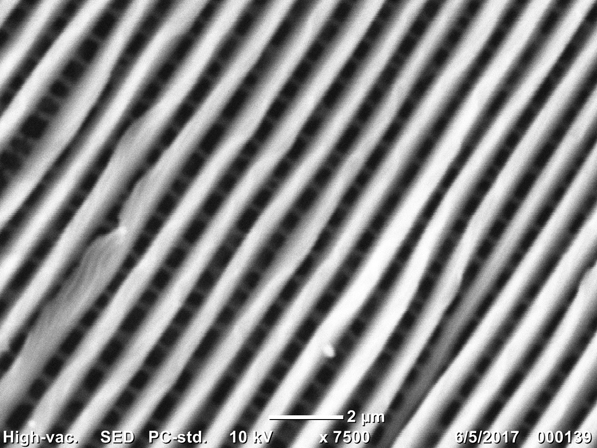
The scales have a transparent base, which is the membrane on the shiny side of the scale. The grainy side of the scales have a porous structure, but different scales have different shapes and ridge distances. The ridges on the scales are parallel to each other, while the area in between the ridges are connected by different structures.
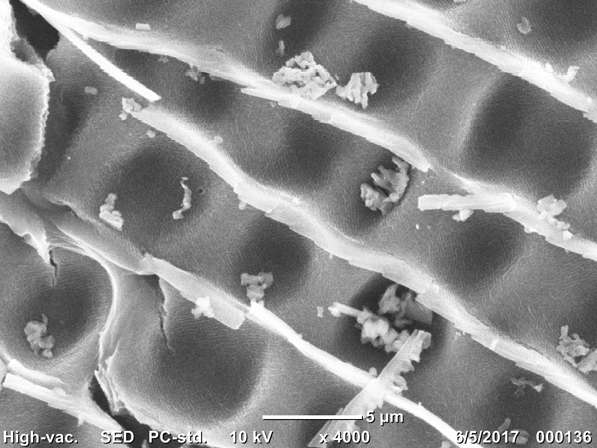
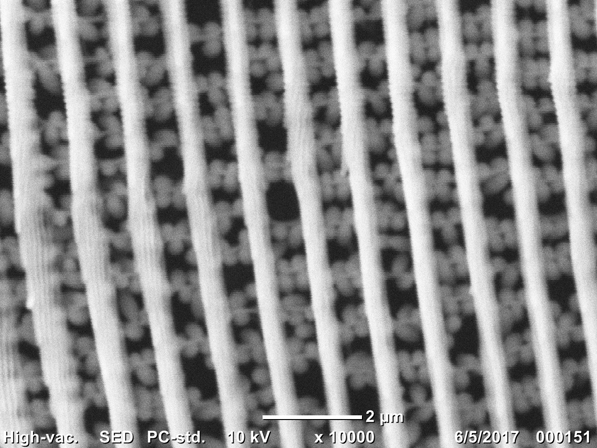
The blue-green scale did not appear to be porous; it appeared to create a pattern of indents in a solid. This scale’s structure is likely due to it being iridescent on both sides. Using a tilting stage to examine the scale helps in finding more detail on the structure. The yellow scale that was anisotropic appeared to have small spheres in between the ridges. While this could just be the structure, it did not seem likely because the spheres did not create a consistent pattern between the ridges as the other scales did. The spheres present could be a pigment; more research would be needed to determine this.

Instrumentation Used
Energy Dispersive X-Ray Spectrometry (EDS)
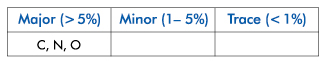
Using an accelerating voltage of 15 kV, a colorless scale was analyzed by energy dispersive X-ray spectrometry. The scale was placed on a carbon stub and carbon coated for analysis, thus, there is less carbon in the scale than the EDS percentage detected.
Instrumentation Used
Fourier Transform Infrared Spectroscopy
Proteins contain amide bonds, and the characteristic spectrum of a butterfly scale contains a broad band at 3300 cm-1 due to nitrogen-hydrogen bonds and two bands, amide I and amide II, occurring between 1680-1630 cm-1 and 1550-1540 cm-1. The amide I band is due to the carbonyl bond and the amide II band is related to both the nitrogen-hydrogen and carbon-nitrogen bonds. Another band around 3100 cm-1 is an overtone of the amide II band. The presence of the amide bands and the overtone is characteristic with protein.
Instrumentation Used
Raman Spectroscopy
The butterfly scale Raman spectra did not produce bands at 514 nm. The sloping baseline observed in this spectrum is indicative of fluorescence.
Comments
add comment