Defects in Food Packaging
June 15, 2016
Presenter: Wayne Niemeyer, Senior Research Scientist, McCrone Associates
Learn some of the current technology utilized for evaluating/characterizing beverage and food packaging defects. 55 minutes.
Transcript
Charles Zona (CZ): Welcome to another McCrone Group webinar. My name is Charles Zona, and today our presenter is Wayne Niemeyer of McCrone Associates. Wayne is going to talk to us today about defects in food packaging. But, before we get started, I would like to tell you little bit about Wayne’s background and experience. Wayne is a senior research scientist with McCrone Associates and has over 40 years of experience. He specializes in x-ray microanalysis of small particles using energy and wavelength dispersive x-ray spectrometry methods with scanning electron microscopy and electron microprobe. His extensive and diverse analytical capabilities span a long career starting in research and development for a major packaging/manufacturing company, prior to his employment at McCrone Associates in 1992.
Wayne will field questions from the audience immediately following today’s presentation. This webinar is being recorded and will be available on the McCrone Group website under the Webinars tab. Now, I will hand the program over to Wayne.
Wayne Niemeyer (WN):
Thank you, Chuck. Welcome everybody, and I certainly appreciate the fact that you’re taking time out from your busy schedules to join us today. I hope at the end of the webinar that you will be able to come away with some good useful information.
We are going to talk today a little bit about defects in food packaging, and I’m going to talk a little about why we would be concerned with something like that, and I will show you some of the instrumentation that can be used for analyzing and identifying these various defects. Then, I will go through a series of about nine case studies to show you how some of this analysis is done, and some of the interesting results that we have achieved.
So why should we be concerned with packaging defects? In 2011, there is a major reform of food safety laws that was signed into law by President Obama. It is the Food Safety Modernization Act. And it’s a very sweeping reform of food safety laws and it’s aiming to ensure that the US food supply is safe by shifting the focus from responding to contamination to preventing it. The key here is preventing it.
Millions of aluminum cans and tinplated cans, glass, and plastic bottles and multilayer plastic pouches enter the marketplace every day, The packaging, manufacturing plants and their material suppliers are really responsible for product integrity prior to distribution of the packaging to the various food and beverage manufacturing operations throughout the world. At the packaging manufacturing facilities the incoming quality control and internal quality control operations are quite extensive. Many of these packaging defects that would normally result in potential consumer issues, are quickly eliminated from the consumer pipeline right in the manufacturing plant themselves.
However, inevitably some defects in packaging will appear the marketplace, and that can result in consumer complaints that must be addressed by the manufacturers.
The cause and extent of the defects must be determined quickly, and by extent of the defects, I am talking about the inspections, perhaps in warehouses prior to the packaging been distributed to grocery stores, for example. Certainly the cause of the defects have to be determined fairly quickly. So, in some cases, that might even mean shutting down production lines at the manufacturing facilities while they’re waiting for answers and corrective actions to be done.
Many of the major packaging manufacturers have extensive analytical laboratories with a vast array of instrumentation and technical expertise for troubleshooting and identifying defects. But, a lot of the smaller manufacturers have limited internal laboratories and they usually have to rely on outsourcing to a network of independent laboratories to assist with their troubleshooting analyses.
So, I am going to discuss some of the common instrumentation that is used for looking at packaging defects. The very first thing that one must to do is just a visual inspection. This can involve, just as the picture shows, even looking at something through a magnifying glass. But, certainly looking at the defects visually to determine what kinds of things might need to be done for future analyses. Then one might move onto a low-power microscope, in this case a stereomicroscope, which is equipped with a transmitted light at the base, then the gooseneck lighting for oblique lighting on the sides. This is very useful for looking at materials, especially on coated cans, metal cans, and then there’s also another lighting system that is not shown here, that one comes down through the objective lens onto the sample, known as reflected light or epi-illumination.
We can move on then to the polarized light microscope. This is a compound microscope, which can be outfitted with many different accessories and various filter systems to look at the samples under varied lighting conditions, and this is a microscope often used to help identify materials by their optical properties.
Getting into some of the larger equipment, the scanning electron microscope with energy dispersive x-ray spectrometry is commonly used in the major laboratories. The scanning electron microscope part of it is used to produce images of the materials at very high magnifications, if necessary. And, it uses an electron beam to impinge onto the sample, and then the interactions of the beam with a sample will produce materials that can be used for imaging purposes.
The energy dispersive x-ray spectrometry system is used to provide the elemental composition of materials. And, this is an accessory that is put onto an SEM, manufactured by other people besides the SEM manufacturers, and this accessory is shown here as the grey tube-like structure on the left-hand side of the column of the microscope.
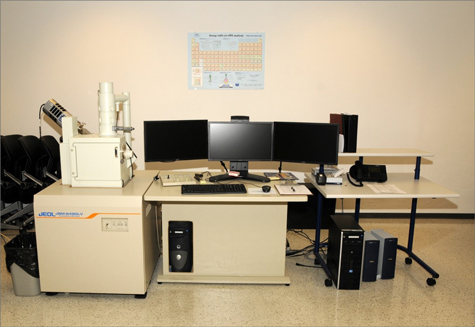
This door is where the stage is, and the system is under a vacuum when we do our analyses.
Then we have the Fourier transform infrared spectroscopy also known as FTIR. Again, we can look at materials here that are mostly organic or carbonaceous materials to help identify the compounds, things like plastics, and paint, and various resins. We can identify the particular material, for example, if it is an epoxy, or an acrylic, or a polyester or a nylon, things like that. Whereas, the SEM and energy dispersive x-ray spectrometry is mainly used for identifying the elemental composition of inorganic materials.
The infrared system can also use larger samples in the “bench” part of it, and, also the infrared beam can be put through a microscope system, in the middle of that image here, and impinged down onto our sample and back up to our detector to produce the spectrum that helps identify what that material is.
There’s other, maybe not so common, instrumentation that can be utilized for analyzing it packaging defects. X-ray diffraction is one where the sample is irradiated with an x-ray beam produced by copper, and this can analyze and characterize crystalline materials to identify the specific compound or compounds that are present in the sample.
This particular unit can analyze individual particles down to a particle size of about 10 µm, so that is quite small.
Then we can also look at Raman spectroscopy. This is another system that is considered more of a system that can be used in conjunction with infrared spectroscopy or FTIR. The Raman system uses a laser beam. In this case, this instrument has three different laser beams, three different wavelengths, goes through the microscope system down onto the sample and then we’re measuring the slight changes in the wavelength of the laser light as it comes back to the detector, called a Raman shift. And, this type of instrumentation is used to identify, not only many organic materials, but also can identify crystalline compounds, mainly minerals is what it was initially designed for.
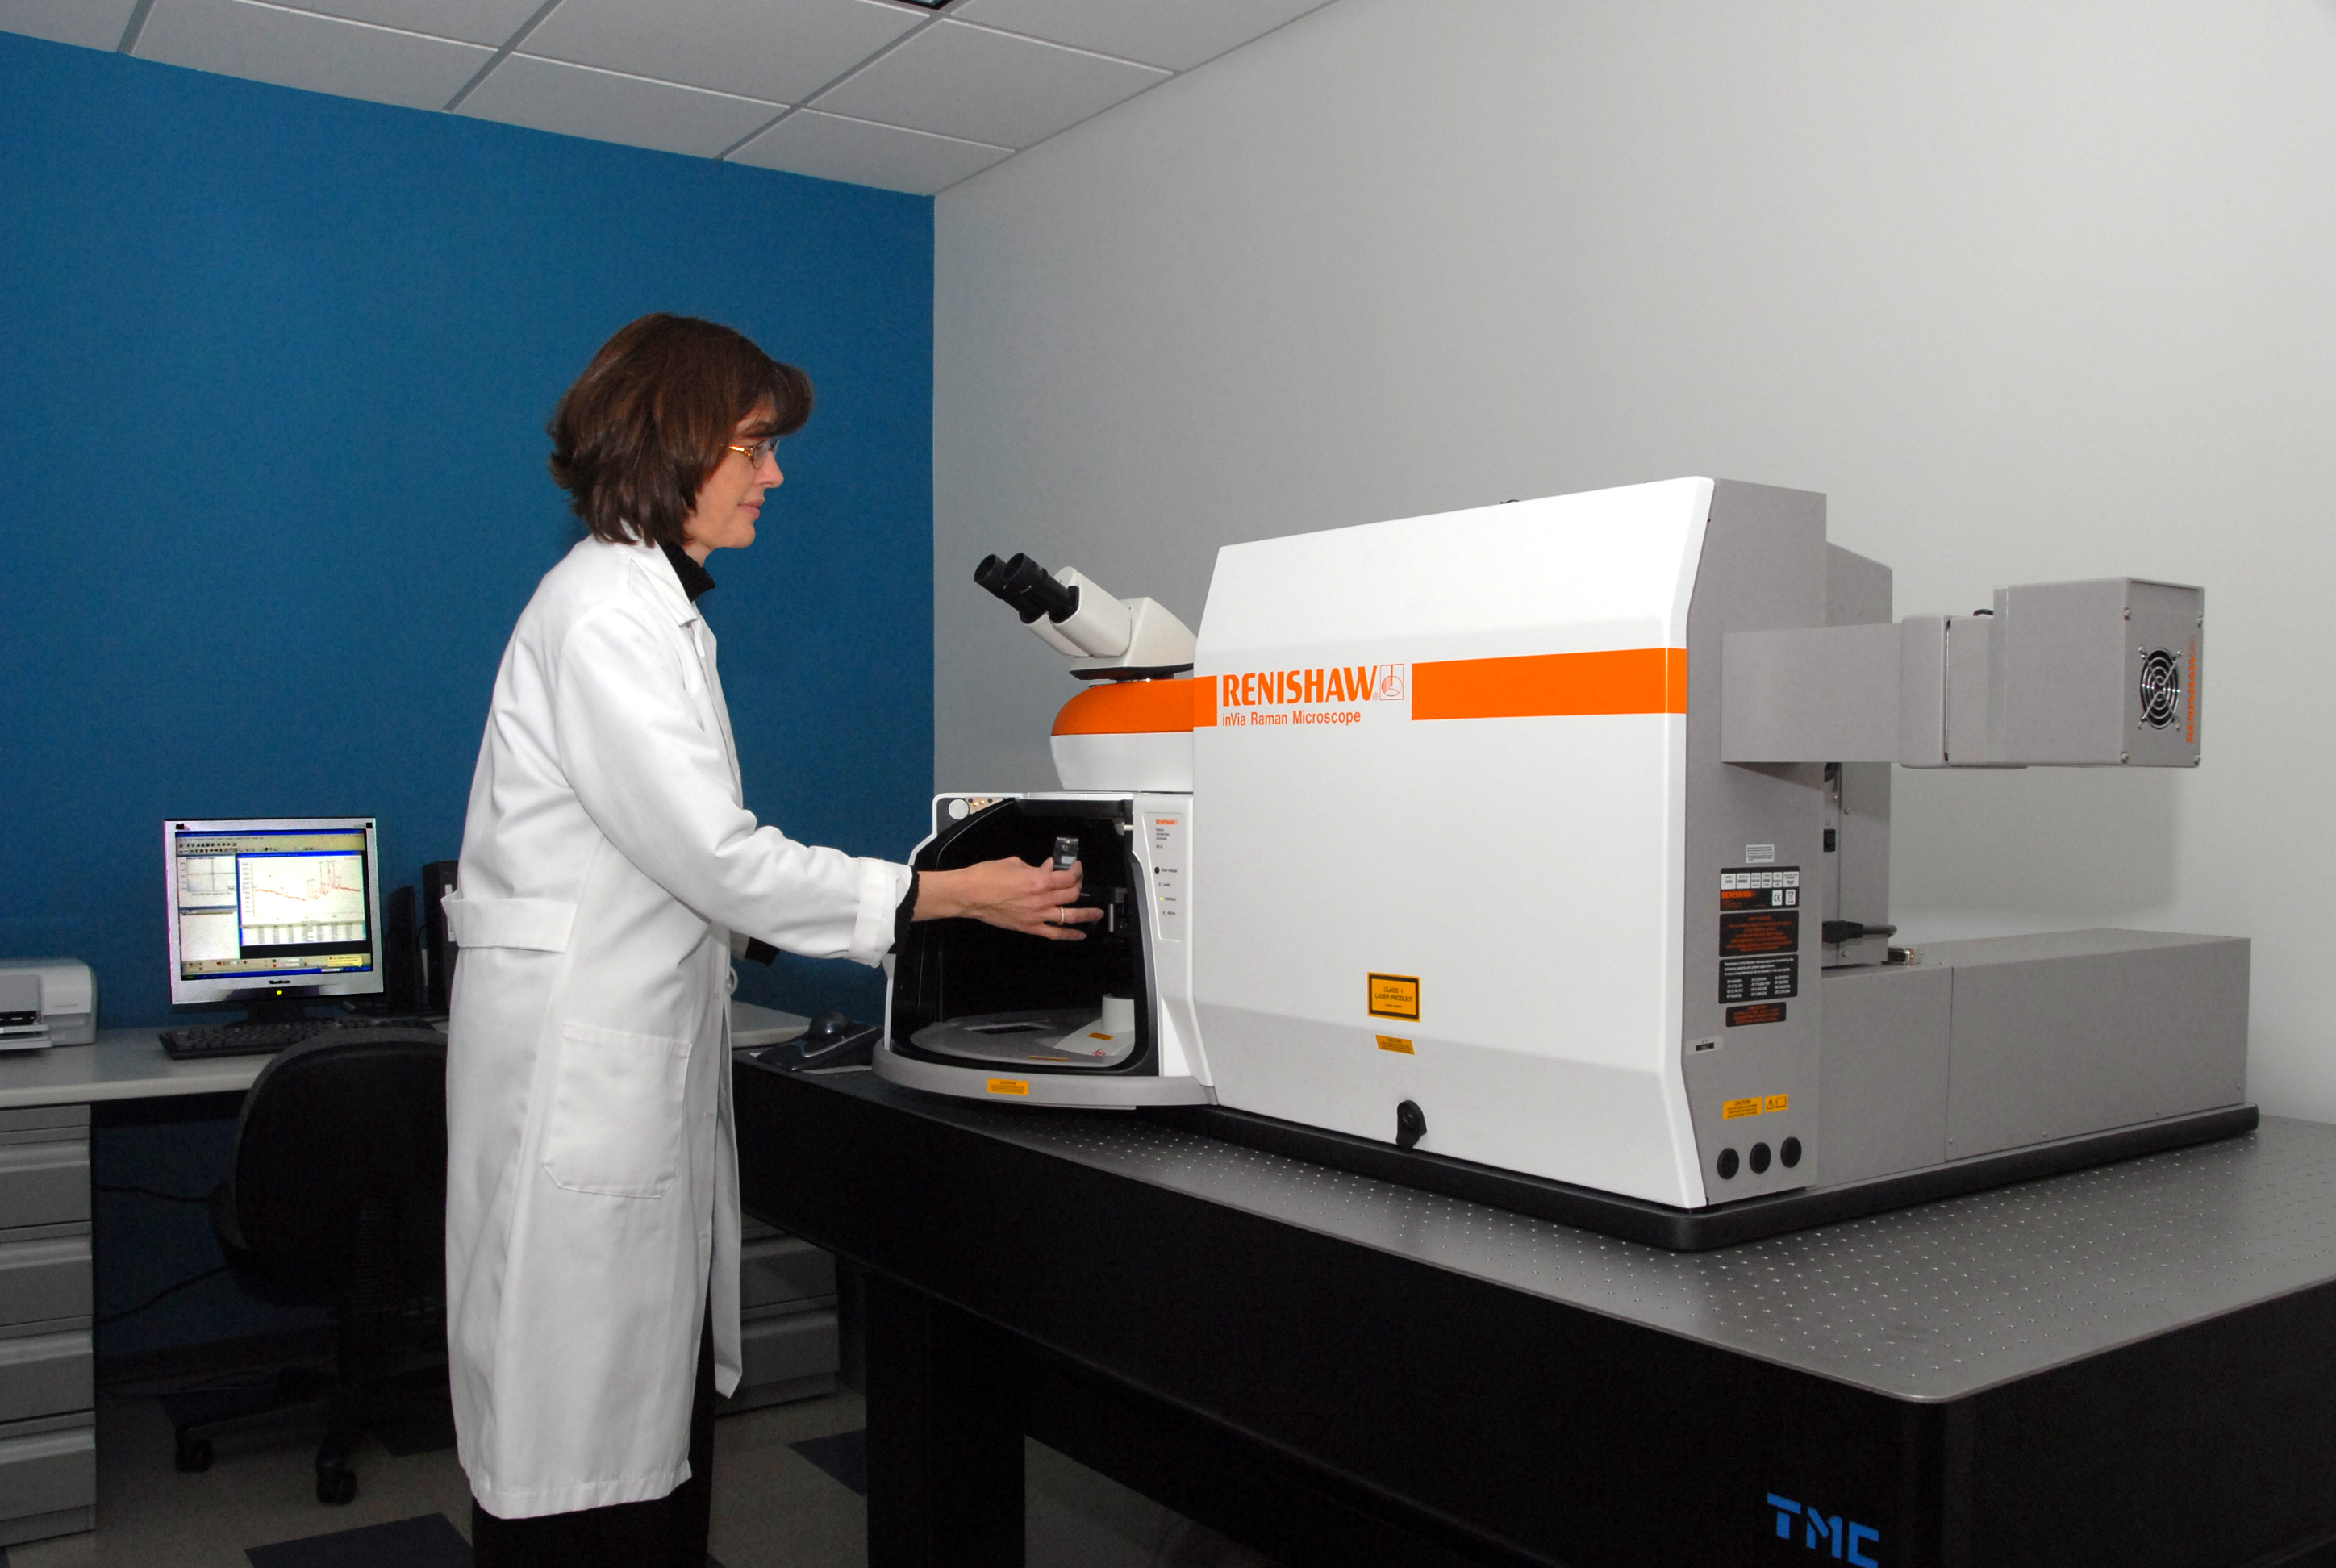
So it is a complementary technique to infrared spectroscopy in the in the sense that in the infrared system there may be some materials that are not very sensitive to the infrared beam and absorbing infrared wavelengths. Whereas, in the Raman with the laser system they absorb quite well and show the Raman shifts quite well. So, that is why they are considered complementary techniques.
We can get into some more really sophisticated instrumentation. This one is secondary ion mass spectrometry and also known as SIMS, by the acronym. Here the samples are bombarded with a plasma beam, typically oxygen, but we can also use argon or cesium. And, the ions that are produced off the surface are produced in molecular layers, so it’s a very surface sensitive technique. These ions that are sputtered off the surface of our sample are put through a series of magnets and into a mass spectrometer analyzer to produce a spectrum that shows the atomic mass or the elemental composition, along with the counts that were achieved at each mass unit. This particular system, the advantage of it, is that it detects all elements of the periodic table, whereas the SEM EDS system cannot detect the light elements of lithium or boron or hydrogen. You can detect boron, I should not say that, but there has to be quite a bit. But, the secondary ion mass spectrometry can also be used to provide depth profiles of materials. So, now if we have a very thin film on the surface of something we can do a depth profile to see how thick it is or we can look at changes in the chemistry of the films as it is penetrating down through the surface. Again, were only talking on the order of nanometers. These are multiple molecular layers, for example, and might be used to look at something like zirconium phosphate treatment that is applied to aluminum cans, for example, that might be on the order of 50 to 400 nm thick.
Then, we also can have another true surface analysis piece of equipment called x-ray photoelectron spectroscopy or XPS, also known as electron spectroscopy for chemical analysis or ESCA. In these acronyms of XPS and ESCA have been vacillating back and forth now for number of years. I’m not sure which one is the most popular at this current time. But, at any rate the system produces a beam, an x-ray beam, from aluminum that impinges onto our sample and produces an elemental spectrum and we can also quantify the elements that are present there in an atomic percent numbers, And, also, the nice advantage of this is that some of the elemental composition can provide compound information by measuring the binding energy of the specific elements.
For example, we can easily differentiate silicon metal from silicone, an oil like material, or from silicon dioxide, which would be a , crystalline material.
And, we can easily differentiate things like that with the XPS system. We can also do depth profiling with the XPS using the argon beam to slowly ionize the surface away as we’re collecting XPS spectra going down through, as we’re depth profiling.
Again it’s a true surface analysis where we can look at several hundred nanometers of material at a time. The XPS is particularly useful for looking at the plastic surface treatments known as Corona discharge and see what chemical changes occur on the surface of the plastic bottles with the Corona discharge.
At McCrone Associates we use what we call the particle approach for identifying and characterizing materials, and in this case we’re looking at defects in the packaging products. We like to isolate the material from the packaging product or around the matrix that it’s embedded in, and try to isolate it and clean it up if we can. Then mount it for particular analytical methods that we want used to characterize and identify them.
So, to do this we have a team of well trained and very highly skilled microscopist do this work in a clean room environment, and you see up the benches here. At each workstation each clean room microscopist has their own stereomicroscope and their own polarized light microscope, and in some cases, some micro-chemicals that can be used for some initial analyses. So, they can do a lot of work to help prepare the material and help identify the material and decide what might be the best course of action for the analysis that needs to be done. And, then, of course they mount the materials for us.
I am going to do some of these case studies, now. I am going to go through about nine of them and these are packaging defects that we received and gone through.
I will discuss a crater defect in a tinplate steel can, of the interior coating of the can. Crater defect in the coating is a pullback of the coating, usually in a circular manner that has a small piece of material in the center of the crater; like you’d see on the moon, for example. You see stuff like that. This is differentiated from what’s known as a fisheye, where the coating is pulled back in a circular motion, but usually from some kind of a liquid contaminant, and you don’t see anything in the center of the pullback area, so it is known as a fisheye.
I am going to talk about some aluminum can interior coating blisters that were formed after the coating had been applied, so the material that was the contaminant was actually on the can surface wall prior to coating.
Then, we will talk about a corrosion attack on aluminum baked product pan. This pan is about 12 inches wide and around 16 inches long, and about 2 inches deep, and it houses baked products, of something like dinner rolls, for example. But, there was a very severe corrosion attack that occurred on this aluminum from the outside in, from the bottom side in, and how it affected the product once that happened.
We will talk about sulfide staining on a tinplate steel tuna can, and sulfide staining is a black product as a reaction with sulfur containing compounds; quite often associated with fish products, and it’s a reaction with iron in the can. It produces black particles, black spots, sometimes black streaks and some of that can also transfer to the product.
Loose end seams can be a big issue on the not only aluminum cans, but also steel cans, but in this case I will show an example of some aluminum beer cans with loose end seams and how that affects the product integrity.
Then, I will discuss a contaminant that was found in a plastic food pouch sheet in the manufacturing facility. We will show how that was analyzed and we came up with a very interesting result on that one.
We will look at a multilayer plastic pouch heat seal failure. It’s a multilayer pouch that is actually two sheets of multilayer materials that are pressed together, and are heat sealed at the same time at the center. We will see what has happened at the center portion when this failure occurred.
And, we have some brown stains that were found under a food can internal coating and we will discuss what happened with that, and how the stains got there.
Severe pitting on aluminum cans prior to applying the coating—this was a very very interesting and challenging project, and I will work on that one last for you.
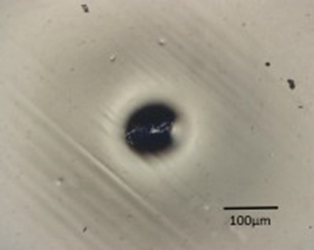
So, here’s the crater defect in the tinplate steel can. Looking at the left side, the image is from a polarized light microscope with reflected light, and a couple of other filters in place so that I can eliminate the glare of the clear coating. And, right in the center is the circular crater, and you can see that there is a piece of debris in the center. It looks like it might be a sliver of some sort.
The EDS elemental x-ray spectrum on the right hand side was taken from this defect right in the can; we did not remove it from the crater because it was fairly large and turns out that the elemental composition is composed mainly of iron, chromium and oxygen. The carbon on the very far left hand side, over here, is from the surrounding coating, but iron is (Fe) and oxygen (O) over here and the chromium (Cr) and a little bit of nickel (Ni), and this is not the steel of the can itself, the tinplate steel can, the metal is generally a carbon steel, which would be just carbon and manganese. So, the chromium, the nickel indicate that this is a foreign steel of some sort that has contaminated the can in the production facility.
Normally when we see iron, chromium and nickel we think of a 300 series stainless steel, but in this particular case we don’t have enough nickel for that, and the iron to chromium ratios might not be quite right either; possibly a 400 series stainless steel which is only iron and chromium, rather than iron, chromium and nickel for 300 series, but in this case is a lot of oxygen. So, this has been oxidized quite a bit, and it might be also a low alloy steel, where the chromium and nickel are very low concentrations in that type of steel, but the iron has been leached away during the oxidation or corrosion process, which would alter the ratios of the iron, chromium, to nickel. In the corrosion processes of these kinds of metals, the iron is typically the one that gets leached out.
Aluminum can interior coating blisters. This is kind of an interesting project because the cause of the blisters seems to be rather unusual. In this case, we have the electron image from the SEM on the left-hand side, and we’re looking at it in what’s known as backscattered electron imaging mode where we can see brightness and contrast differences due to average atomic number.Which means something like this: the surrounding coating around this blister is a fairly low gray color, this is low atomic number material, which it is. It’s the coating, the organic carbonaceous material. But the brighter spots in the center of the blister within this region, identified as spectrum one, are higher atomic number materials. And, here we can see in the EDS spectrum next to it that aluminum is the major component. But, that’s from the aluminum can underneath the coating; we’re seeing x-rays from all the way through the coating to the aluminum substrate. The interfering elements are the sodium (Na), the chlorine (Cl), and the potassium (K).
So, these are sodium and potassium chloride salts. These are salt crystals that must have been on that wall before the coating was applied, and then through migration of moisture through the coating, generally from just humidity in the atmosphere before this can was even packed with anything, started a corrosion reaction. Chloride salts will very aggressively corrode aluminum and produces oxygen gas as part of its byproduct, which produces the blister as its expanding. So, the sodium, the chloride, and the potassium salts was interesting because this is the typical composition from human sweat. The only place that this could occur, this could even happen in production facility, is after the cans are manufactured at the body maker, or formed at the body makers to form the cans. They go through a washing process and it is a belt washer and the cans come out at the end of the washer after they’ve been cleaned and rinsed and dried, and they’re facing upright. The open end is up. So, anything above those cans could fall into the cans before they go into the track work and get to the printing and coating operations. So, it’s possible in this particular case, if the production facility was in a very warm, humid environment that people could be working around here. Perhaps they were doing some maintenance, perhaps there is something else going on, troubleshooting, there is a lot of the perspiration that was dripping from people and got inside the cans. That is a possible explanation for this. I have seen this a lot in other things and it is the typical composition that we see from perspiration salts.
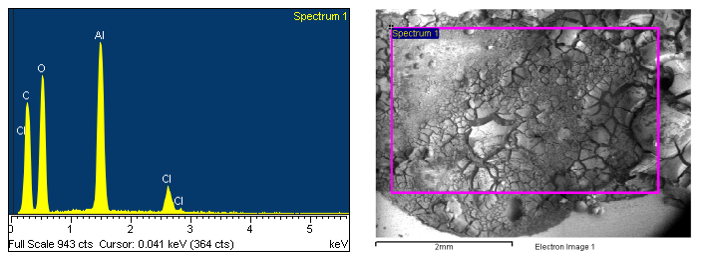
Now, the corrosion attack on this aluminum baked product pan, as I mentioned before, it’s about 12” x 16” x 2” the pan that had some severe corrosion from the outside bottom. Here is the image of one of the corrosion sites, it is on the right hand side this time, of corroded aluminum oxide, the mud cracking appearance, very aggressive corrosion. And, on the left-hand side we have the EDS spectrum of it. We see that there’s chlorine involved, again, here with high oxygen and the aluminum, of course, some carbon. But there aren’t many other salts associated like the sodium and potassium, or calcium, or anything like that with the chlorine.
So, it was suspected that this might have been something like bleach, which is a chlorinated material, hypochlorous acid type thing, and it might have been someone that had cleaned the shelving with some bleach, and then put the pans back on the shelving while still wet, and that just started the corrosion reaction going like crazy.
What happened was that the perforations came all the way through the bottom of the pan and some of the corrosion product got onto the back of the baked product. So, here’s the SEM image of the bottom of the baked product from the pan on the right hand side. On the left-hand side is the spectrum of it. Most of its carbon and oxygen from the left-hand side, the carbon and oxygen, and that’s from the bakery product itself.
But, then we also see here the aluminum and some chlorine, and just a little bit of calcium, perhaps. But, we can see that this corrosion product now is becoming a contaminant on the baked product that was in the pan. So, this can cause some serious problems with integrity.
Sulfide staining, as I mentioned before, is a black appearing material that can appear on the can or can appear on the product. In this particular case, it was the end of the can, on the top end that we open, not on the sidewall or the bottom of the can itself. And, in this case, the internal coating of that end we were looking at with the scanning electron microscope, again with the backscattered electron image, and we see the bright spots in there which are high atomic number material compared to the surrounding coating. Well, because it’s the tinplate steel can, we expect that those bright spots are going to be the higher atomic elements of tin and iron. And, that’s, in fact, what we found.
But, before we did that, we looked at it with another imaging mode in the SEM called topographic imaging, where we can tell if these bright spots are depressions in the coating or if they’re just sitting on top of the coating. And, as you stare at that image that topographic image some of you might see that it looks like deposits on the surface of the coating and others of you might see it as depressions in the coating. This is very common when we look at topographic images. What we need to do is look at the shadowing effect of the image. In the SEM the software is set up such that a depression will show up on the edge, it will be a bright side of the edge on the left-hand side. On these depressions the bright areas are on the left-hand side and the dark areas are on the right hand side. That’s an indicator that it is a depression in the coating. If it had been just the opposite, if it had been bright on the right hand side and darker on the left-hand side that would indicate that it’s a protrusion or something sitting on top of the coating.
These are all depressions in the coating. They are quite small, here is our scale bar at 50 µm at the bottom, here. So, these things are sub- 20 µm in diameter, typically. They are not going to be visible by the naked eye. That’s probably the hard part of this. But, because they’re depressions, and we saw a lot of this surveying around, it looked to me like these were foam bubbles in the coating — where the coating was foaming a little bit while it was being applied and these are bubbles that had collapsed, producing a much thinner region of coating in the center of these depressions or possibly even exposing the metal altogether.
If we look at the EDS again, we can do elemental mapping with the x-ray analysis and EDS system. Here we have another backscattered electron image showing a little lower magnification and lots of bright particles all over the place. We can see the maps now for the distribution of tin, which is the blue map and iron which is the orange map and then down below we have sulfur, which is the yellow map. So, we can see that all of these bright spots are exposed tin and iron, and the exposure is to one degree or another might be total exposure or it might be just very thin coating that we can see right through it. If we look at the sulfur (S) map, we can see the yellow spots don’t always correspond to every single bright spot of tin and iron, but there is a grouping in the upper left-hand corner where the sulfur concentration is quite strong. We can see that these areas here were probably where the coating had pulled back and actually exposed the metal completely. Now the sulfur containing compounds in the fish product are able to react with the iron to produce the iron sulfide. This is where they were coming from.
Loose ends or loose end seams—this is of aluminum beer cans, but this could also happen on beverage cans, as well. I am talking about the seam of the end that we open right around the perimeter, that’s the seam. It’s known as a double seam. The seam is formed by the…, I am going to show this in one of the cans is actually tipped down on its side, but the blue area is the can body, the sidewall of the can coming up into the aluminum end, and it curls around, this is the flange area of the can. And, then the aluminum end coming in to the flat part of it, is off to the top and coming around at the corner with the seam is formed, it goes up and around the aluminum flange from the body and down and back up again to form an overlap between the end and the body hook.
So, in here there’s also a resin compound that’s also provides helps provide, a sealing agent when all this stuff is pressed together and formed in the filling operation.
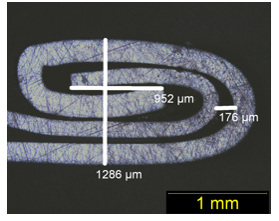
Here is an example of seams in cross-section. These have been embedded in an epoxy mount and I call them semi-polished, they’re not polished mirror finish, there are still a lot of scratches on them, but to show what we need to see is how the seam was formed and this is plenty good polishing. On the left-hand side we have the normal tight seam, where I have some dimension showing here, where the total width of the seam is 1185 µm or 1.185 mm in length, and the body hook crossover area here is about a little more than a millimeter long. That is a normal seam. Now, here’s the loose seam on the right hand side. We can see that the overall with is about 1.3 mm compared to 1.2 so it’s almost a 10th of a millimeter wider than it should be. Well, maybe not than it should be, but it is certainly wider than the tight seam. The overlap area is also about a little more than a 9/10ths of a millimeter long and the loose seam so it’s not pressed together quite as far, and we also have a larger gap appear at the top where the end is coming over the body hook of the flange of the can. Again, it’s about the 10th of a millimeter of more space here compared to the normal tight seam which is about to 0.07 mm.
So, this loose seam can result in a problem where, especially in the pressurized cans, the beer cans or soda cans, if you will, the carbon dioxide can start escaping through these regions because they are spread apart too much. And, that course allows the beer to go flat, but if the carbon dioxide from the product can get out, and once there’s enough pressure difference, the air from the outside can come back in. Therefore, we might see some spoilage of the beer that way. It gets stale. If the seam was loose enough, the product can actually leak out from the seam and spread out onto the side of the can, then start contaminating cans next to it in a pack, or on the store shelves, or possibly, even more likely, in the warehouses where filled cans can be stored, and that can be catastrophic failures if they start getting product leakage all over the place, because then all kinds of corrosion reactions can start occurring at that point.
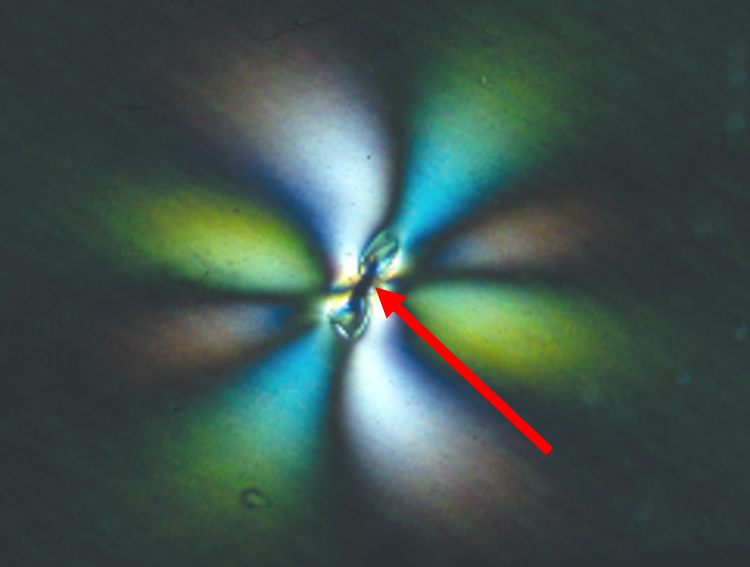
Here is a contaminant in a plastic food pouch sheet. On the left-hand side we’re looking at through a polarized light microscope, again and we’re viewing it with transmitted brightfield lighting. This is a common lighting that we would start with on a transparent type product or material. I have a couple of arrows showing on the left-hand photo that show some regions that looked a little bit strange, but very difficult the see. This is a clear film, so it is very difficult to see much contrast on anything that might be there.
Inserting some polarizing filters into the light paths we can then image these things in much clearer fashion where we can see now that at these little sites that look suspicious, now they are definitely more than suspicious. There’s a problem here. These little white balls or light areas that are coming from the center of these areas are known as strain birefringence lines. In other words, there is something embedded in this film that’s causing the film to be stressed and strained. It is being pulled. These are stress patterns or stress birefringence lines, they are called when looking at through the polarized light microscope. That makes it very easy to find these things. They were all over the place on this particular film. When we go to a little higher magnification, shown on the left, we can see the pinwheel pattern and even different colors, now, of the birefringence stressed lines. Now, where the arrow is pointing here, is our contaminant that we need to identify. In this particular case, we use the Raman spectroscopy, because the microscope on the Raman system is a polarized light microscope, and that helps us locate things very easily to put the laser beam onto the specific source in the product, and this particular spectrum shows that this contaminant is graphite.
Raman spectroscopy can differentiate graphite, which is pure carbon and can differentiate it from another pure carbon compound, diamond. Or it can differentiate it from other carbonaceous compounds that are non-crystalline materials or amorphous type materials that has a different pattern to it. So, the Raman spectra of these carbonaceous things can be quite definitive. In this case, graphite is a very distinctive spectrum in the Raman system to identify it specifically as graphite, rather than just a hunk carbon.
This is the multilayer plastic pouch that suffered a heat sealing failure. These are two sheets with similar layers on each sheet, and then they are pressed together on each other, like mirror images onto each other. They’re pressed and heated such that they would form a bond, this bond would melt in the center and form a nice continuous bond all the way across. But, you can see in some of these regions, that that bond has not formed properly and it turns out in this particular group of samples the bond was not formed, the lack of bonding, was in the exact same area of each pouch, meaning that the equipment, manufacturing equipment, in this particular area either didn’t have enough pressure or there was a cold spot in the dies or maybe the dies weren’t aligned quite right in this area to produce this kind of incomplete seal.
What happens with this, this causes a weakness in the pouch and these are flexible pouches filled with liquids and so forth, and if they’re moving around the seam is also being stressed and moved and opened up even more, which can result in product leakage, eventually.
The brown stains under a food can internal coating were quite interesting. Looking at the stains with a polarized light microscope using the reflected light system, now, and using the crossed polarizing filters in the light paths, we see the stains look like orange spherulites with these black lines, or crosses, even, in some of them, and that initially looked to me like it was starch grains, like they were flattened starch grains. Starch grains have this similar type black lines and crosses. These are known as isogyre lines, and all starch grains have these and so when I saw this in the food can, to me look like flattened out starch. But, that wasn’t the case. When we put it into the scanning electron microscope, now on the left-hand side we are looking at some of the orange-type spherulites that are these gray circular regions now and when we collect, an EDS spectrum on the spherulite we see that the composed mainly of iron and oxygen. The tin is a little bit from the tin plated steel underneath. If we were looking at just the tinplate itself, we would have a very high tin content compared to the iron, in this case is just the opposite. So, this is mainly an iron containing compound. The zinc or the (Zn) peak is from the zinc oxide that’s built into this coating of the can. These are those small bright specks that are peppered all over the coating in here; that is the zinc oxide. So, anyhow, this spherulite seems to be just iron oxide, but we wanted to go a little further with it. So, we had our cleanroom isolate some of those materials, and this is what they look like under the polarized light microscope, Again, looking with transmitted light now, and partially crossed polarizing filters, so we don’t have such dark background. But, now we can see that the black isogyre lines are gone, they are not here, which means that must have been some kind of optical effect that was being caused by the coating on the can when I was looking at it initially. So, now the cleanroom is able to mount these materials for x-ray diffraction analyses.
The x-ray diffraction data, shown in the table on the right hand side, shows what’s known as the d-spacings. These are the inter-atomic spacings of the crystalline material, and these d- spacings can then be compared to a massive database. It’s an international database of diffraction data to identify the specific compound. In this case the compounds were identified as iron carbonate. So, they were definitely not iron oxide. There were iron carbonate.
So, what that meant was that we had a corrosion reaction going on attacking the base steel and the product that was packed in these cans was a water-based product and what was happening was that the coating was actually under cured and the water was migrating through the coating. And once it diffused, and found the base steel it started the corrosion reactions. It was producing the iron carbonate material that was kind of oozing from the small pores through the tinplate that exposed the iron and as it was oozing up, the corrosion product was spreading out under the coating. So, it was not forming a mound, it was just spreading out in a spherical fashion.
This is the last one, now. This is a particularly interesting case. The severe pitting corrosion aluminum on cans. Again, this is prior to applying the internal coating on cans. This was published and it was also presented at a conference many years ago, now. Frank McDonough from Quaker Chemical, myself, and Mike Shuster from Ball Packaging International were the co-authors of this, and you can download this entire article from our website. You can download the entire article if you’re interested in it. It was a very, very interesting and challenging case I am just going to hit some of the highlights of it.
Here is what the craters look like. Almost more like a fisheye, but there was some material in the center of the area, the black area in the SEM part of the image is the coating, and the brighter area is where the coating had pulled back in a circular form to expose the aluminum. Now, this exposed aluminum and premature pitting attack, which is down in here, was labeled as arrows 1 and 2, can result in very rapid perforation of the cans, which would result in loss of product and also contamination of surrounding cans to continue the corrosion reactions from the outside and become catastrophic failures from the whole batch of cans. But, we needed to know what was causing this pitting attack. Looking at it at higher magnifications in the SEM, we see that the corrosion pits are very deep. It’s a very aggressive corrosion reaction going on here, and it’s occurring sometime between when the cans were manufactured and the time that they were washed and cleaned to remove all the oils and stuff. So, something was happening right in that timeframe. Our EDS analysis within those pits did not reveal any evidence of inorganic contamination or any other evidence of corrosive agents, such as chloride, sulfate something like that. We also did some FTIR, we saw no evidence of organic contamination and we were looking mainly for something like organic acids.
We did some solvent micro-extractions from the pits to see if we could pull something out there. Again, we found no evidence of any contamination. We did not even have much of a corrosion product, and it was so aggressive and so rapid that it was just pouring through the aluminum very rapidly. So, we resorted to SIMS analysis, the secondary ion mass spectrometry, and here we’re showing the spectrum of mass atomic units, which is the elemental composition, versus the counts, and this is a logarithmic scale of counts. We saw fairly quickly that boron (B), and calcium (Ca), the peaks in the normal surface of the aluminum where the pits aren’t occurring, these are the levels that we found there, but within the pits we found elevated boron and calcium. There is actually on a logarithmic scale, these are actually hundred fold more concentrated than they were on the normal surface. So, we knew within the pits we have a lot of boron and calcium.
That steered us into doing some mapping within the pits. We can do the elemental mapping by SIMS, again. These are known as ion maps, but here are the maps for calcium, boron, and iron within two pits. We can see that all three of these elements are associated with one another.
The bright red and orange and yellow areas are the high concentrations of each element. So, that discovery pointed to the cooling tower water that’s used in the heat exchanger tubing within the 7,000 gallon lubricant/coolant system that’s used for the can manufacturing process, at the body makers. So, we speculated that a borate corrosion inhibitor, which is very commonly used for steel corrosion resistance, was used in the cooling tower water. The cooling tower water was made of steel, as were the exchanger tubings. The high levels of calcium and iron were also found in the water itself, and there were some additional factors that made the cooling tower water very corrosive to aluminum, mainly pH and alkalinity, very high pH. Aluminum corrodes very aggressively in alkaline materials or hydroxides where the pH is above about 9.5 or 9.6.
In this case, the cooling tower water was somewhat higher than that. So, when the lubricant/coolant system was dumped out, subsequent inspection of the heat exchanger tubing revealed that there were several cracks, and that was certainly the source of major cooling tower water leakage into the cooling system which would then contaminate cans and produce all corrosion that was occurring.
So, typical packaging defect dilemma that you might run across is — this is one of my favorite cartoons being an analytical microscopist myself—here is a guy looking through the microscope with two other people standing there, and one of them says… “Whatever it is it’s very, very little” or very, very tiny.
Well, for us, that’s not so tiny. Our solution, analytical microscopy, can help identify whatever it is; the tinier, the better. In other words, if we can see it, we know we can analyze it. If we can’t see it, we can probably still analyze it.
So, I thank you for spending your time with us today and here’s my contact information if anybody wants to talk more about this or has some other comments to make. And I will turn it back over to Chuck.
CZ: Thanks, Wayne. If anybody has any questions we will take a few minutes to have people type those into the question field. We will start here momentarily. We will give it a few more seconds here, see if we can get any questions answered about the presentation or the equipment or the analyses, whatever is on your mind we will try to answer.
Here comes a question from Stephanie, “How are defects discovered on the interior of cans if the defect itself isn’t causing problems with the product, such as the craters?”
WN: The defects on the cans, if they’re there to begin with, chances are they will cause a problem with the product and that’s the whole purpose of this. The manufacturers of the cans, or any packaging materials, they are responsible for the integrity of that packaging material and if something does go wrong because of a defect in that packaging material that exposes the product to an issue because of that, that becomes their responsibility to help resolve. So, the packaging material is a very important step in that chain of food safety. It starts out at the farms, for example, and goes into the processing plants, and then from there it goes into the manufacturing facilities that fill the containers, the packaging containers, and then it goes into the distribution systems, and the transportation organizations, and the store shelves the store manufacturers for product support. Everybody along that whole chain has responsibility for maintaining food safety. So, defects in cans or the packaging is just one part of that chain.
CZ: It looks like a Gara has a question: “You mentioned that the salt composition was close to perspiration. Could this also be from tap water composition?”
WN: No, the tap water composition would usually have high concentrations of calcium and magnesium, and silicon. In this case, we were only seeing sodium, chlorine, and potassium. So, that wouldn’t be from a saltwater, or I mean tap water.
CZ: From Lisa: “How would you approach a product tampering case differently than a defect in food packaging?”
WN: We would approach it in pretty much the same way. Product tampering has always been an issue, for years and years. There are certain things and certain characteristics of tampering that we can look for that would help identify that it was a tampering case versus some accidental contamination.
CZ: From Jan: “Do you get product defect from customers or only from manufacturers?”
WN: We typically don’t get defects brought to us from consumers, in other words, the general public. By customers though, those are our clients, and they could be manufacturers, they could be of perhaps a grocery store, it could be of a trucking firm, for example if something was happening during transportation, things like that. But, not from the general not from an individual consumer. No, we would not take something like that in.
CZ: Great. From Richard: “I saw you used the FTIR mostly for identification of organic compounds. Is it a useful tool for identifying inorganic compounds, as well?”
WN: Usually not. The FTIR can be used for some inorganic materials but, you have a special detector on there that can detect those kinds of things, and mainly looking for the mineral grains, commonly found in dirt, if you will. You can do that. It’s that inorganic stuff is more easily identified by the diffraction technique or the Raman technique or even the EDS elemental technique.
CZ: Okay, here is a question from David: “By what mechanism does boron attack aluminum is the boron itself?”
WN: It’s not the boron itself that is attacking the aluminum. The boron was considered to be an additive to the cooling tower water, and the borate salts are typically used just as corrosion inhibitors for steel, so that in itself wasn’t a problem for the aluminum. The presence of the boron, though, is what tipped us off to the cooling tower water because that was about the only source of any boron within the whole facility. The cooling tower water had a very high pH and alkalinity, and it was also tap water so it had a lot of calcium in it, and it also had some iron in it just from the steel. So, the boron was just a tip of where the source was coming from. And, so is not the attack itself, the main attack on the aluminum was from the high pH and alkalinity of the water.
CZ: And, again, from Stephanie here: “Why is sulfite staining more common in cans that contain fish products versus other products.”
WN: Fish products have a lot of sulfur compounds in them. That doesn’t mean that sulfite staining won’t occur in other products. We have seen in it some of the green vegetables, for example. We have seen it occasionally. But, fish products are notorious for causing sulfite staining.
CZ: And, here is a question from Jake: “Is EPMA, the electron microprobe, ever beneficial in this type of failure defect analysis? Why or why not?”
WN: The microprobe is the same as the SEM in the sense that it has the same kind of column with the electron beam, it can have the energy dispersive x-ray system with it for the elemental composition. But, the microprobe, usually or will have a wavelength dispersive x-ray spectrometer on it, as well. That also can detect elements, one element at a time and per spectrometer, whereas EDS system can detect all of the elements at one time. That’s why EDS is pretty much preferred. But, WDS, the advantage of it is that it has lower detection limits for most elements, on the order of maybe a magnitude or more lower detection limit than EDS does. Also, WDS in the microprobe is great for mapping the distribution of the elements.
CZ: Great. I think that may do it for the questions, Wayne. We got through all of them. I would to like to thank everybody again for attending today’s webinar.
Comments
add comment