Electron Micrographs and Elemental Maps of Sands from Around the World
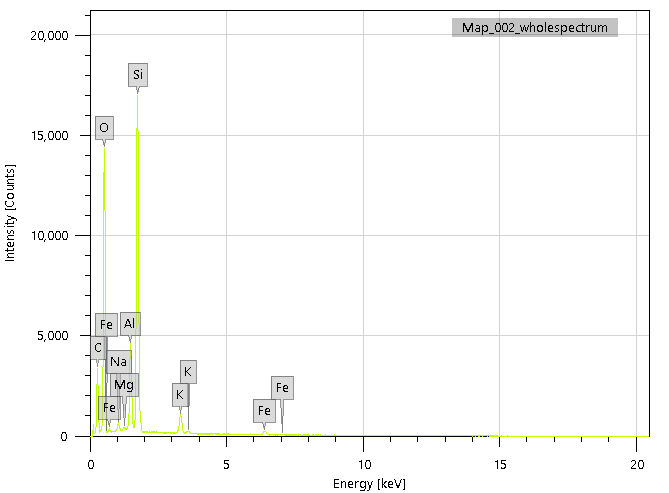
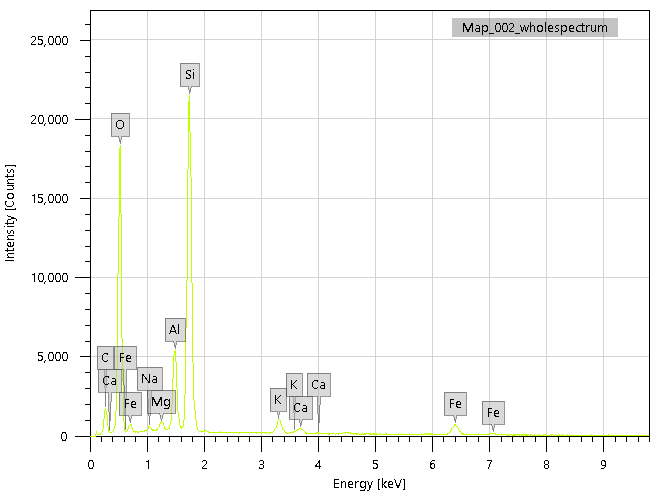
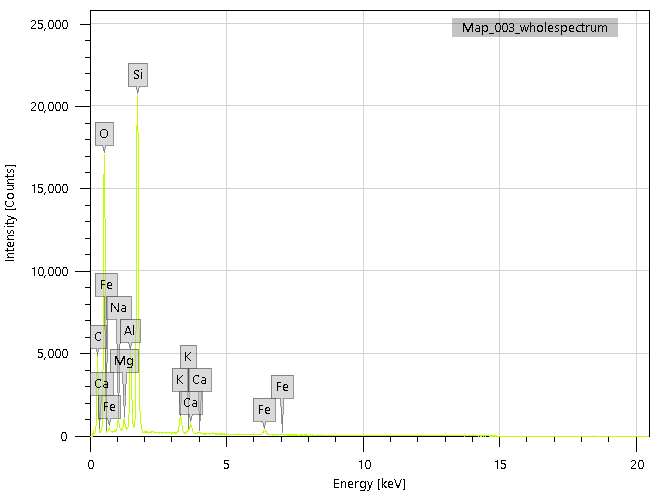
In our last Sand Gallery post, we asked readers if they would like to see electron micrographs of the Microscopy Society of America’s (MSA) Project MICRO SANDBOX sand samples as a supplement to our low-magnification photomicrographs that we have been providing. The overall response was yes, and so that’s what we did for this article. In addition to the electron micrographs, we have included elemental maps and the energy dispersive x-ray spectroscopy (EDS) data with each sand sample. Below are the latest Sandbox requests made by teachers who are utilizing this MSA resource for their classroom.
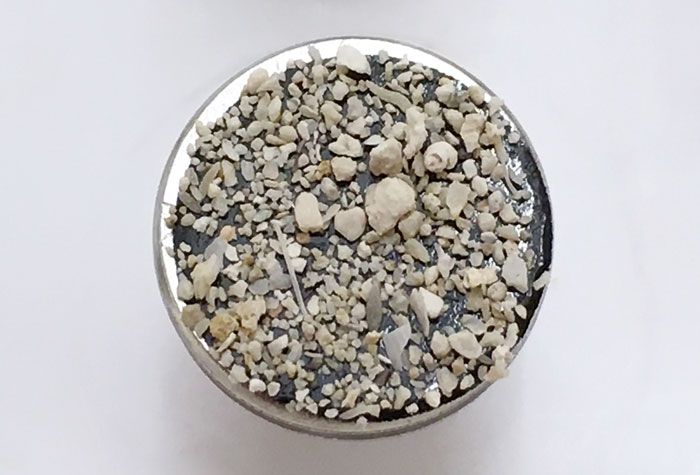
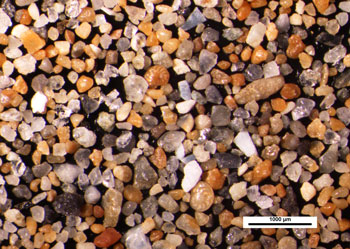
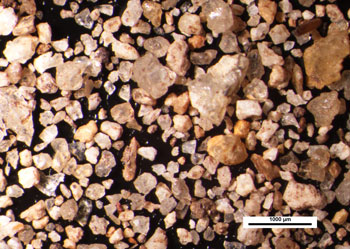
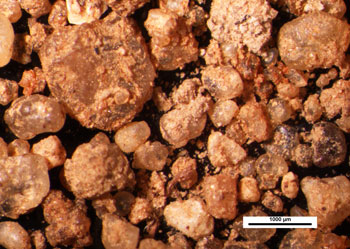
Our challenge was to create electron micrographs and elemental maps from the same field of view as the stereomicroscope’s low-magnification photomicrographs. Each of the ten requested sand samples were first prepared by pouring the sand samples onto a 10 mm diameter piece of carbon tape attached to a 10 mm scanning electron microscope (SEM) pin mount. This is the same sample preparation method we use when mounting sand samples onto archival tape attached to cardstock.
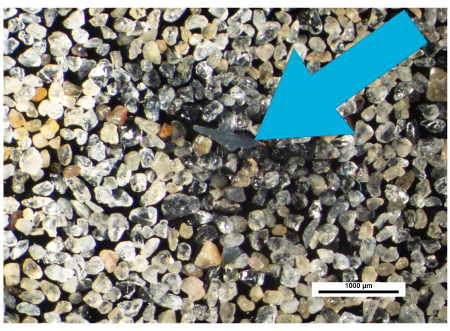
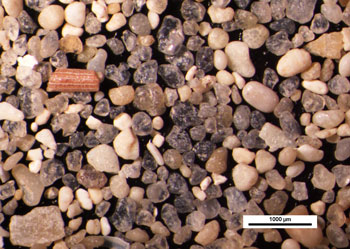
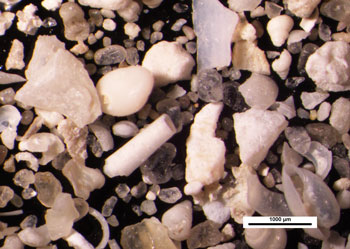
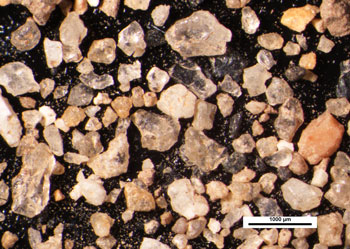
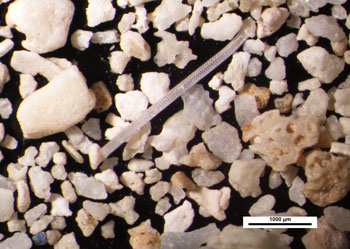
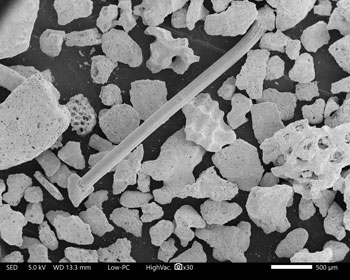
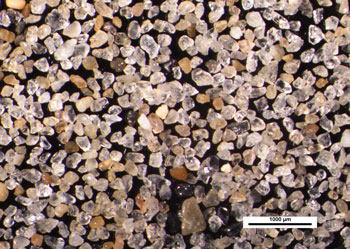
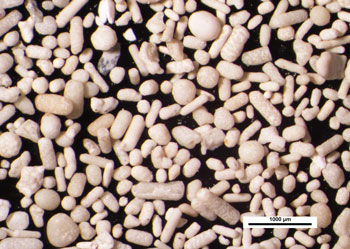
One of the drawbacks of depositing the sand in this way is that some of the elongated sand particles will come into contact with the adhesive substrate in a vertical orientation. In other words, the grains of sand appear to be defying gravity—rather than lying in what would be their natural, horizontal (flat) orientation, think of a pencil standing vertically instead of lying flat on the desk. This problem is easily solved by taking a medium-tip-sized tungsten needle and moving any elongated grains over onto their sides, and then photographing that field of view. Doing this usually does not impart much background color to the individual sand grains, especially if you are using a transparent glass plate to support the sample. However, applying the same reorientation technique using black carbon tape as your adhesive substrate results in many of the transparent sand grains appearing dark, or, in some cases, completely black, indicated by the blue arrow below.
When prepping for SEM/EDS analysis, the use of carbon tape is necessary to reduce electron buildup on the surface of the sand samples, and serves as a conductive pathway for electrons to travel. By creating this conductive pathway, an undesirable charging phenomenon is greatly reduced, and results in better imaging and (EDS) data.
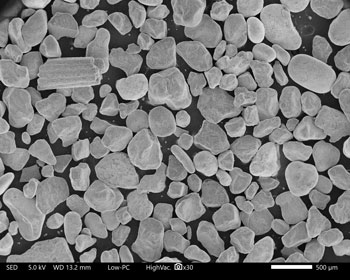
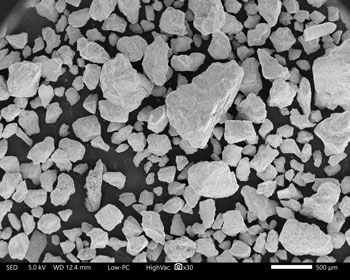
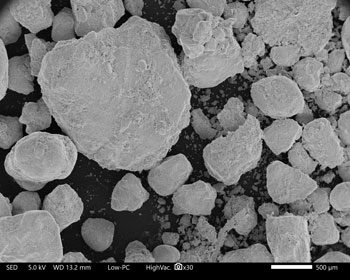
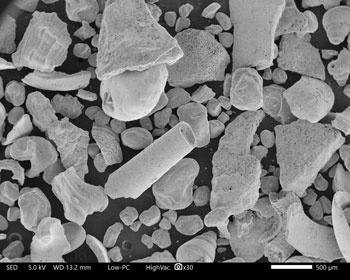
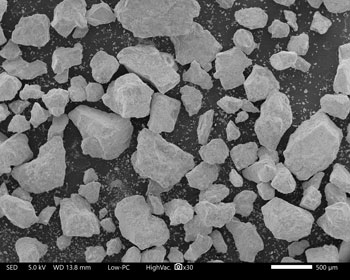
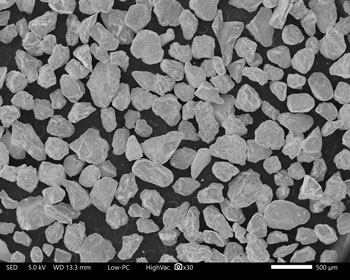
Each of the sand samples was inserted into the JEOL JCM-7000 desktop SEM chamber and placed under vacuum for observation. The JCM-7000 Stage Navigation System was used to locate the same field of view from a printout of the stereomicroscope image. The orientation of the image was duplicated by rotating the direction of the beam scan until the images looked identical.
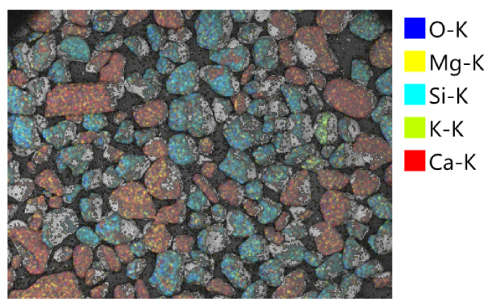
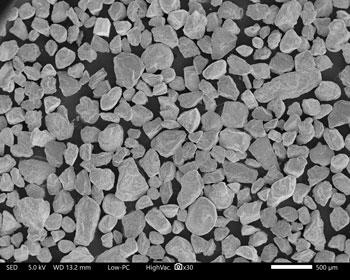
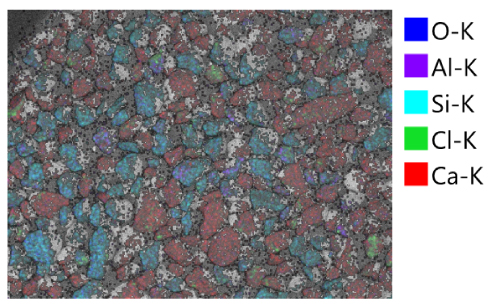
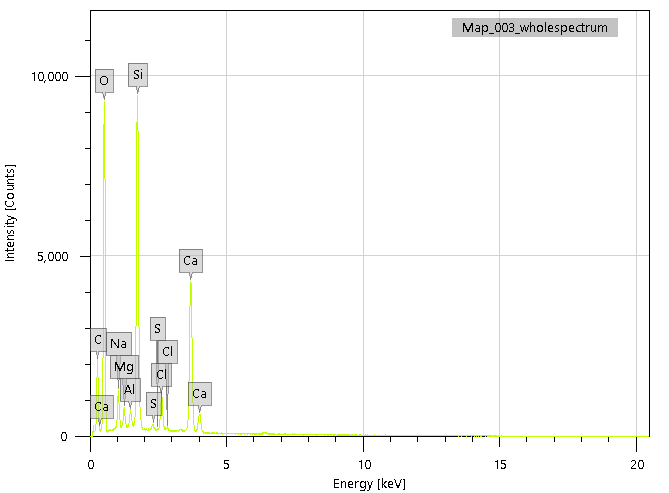
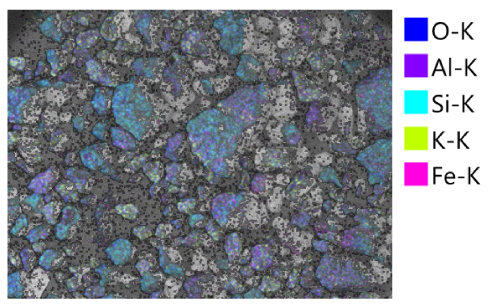
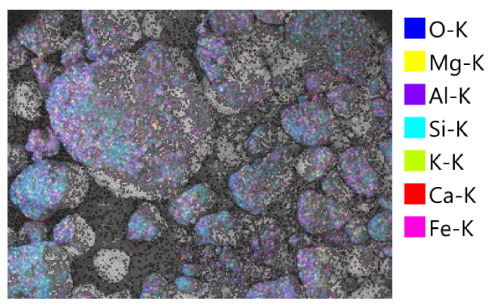
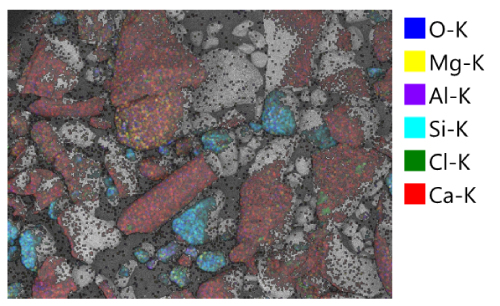
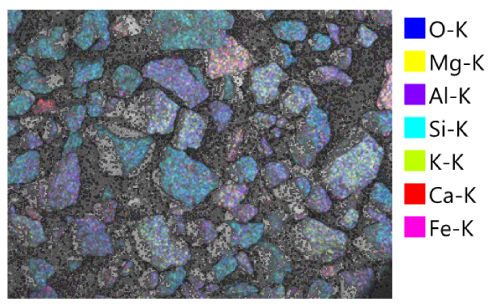
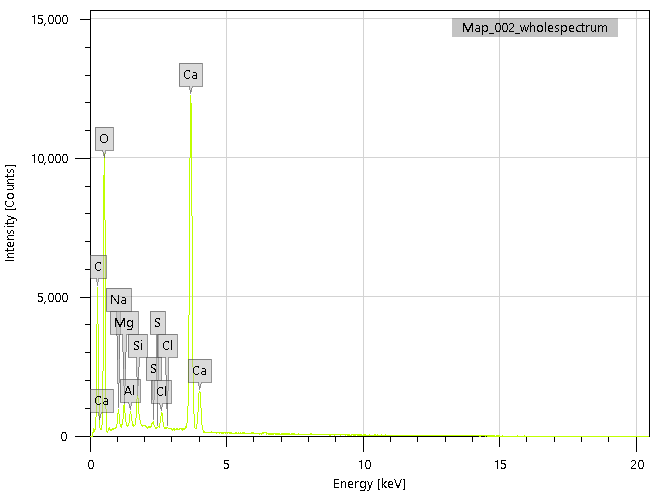
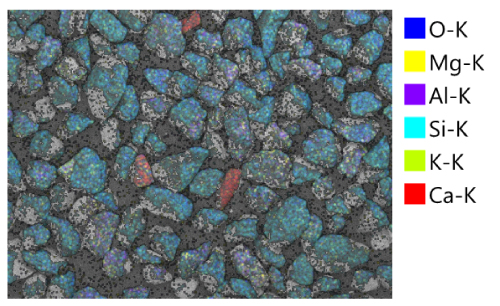
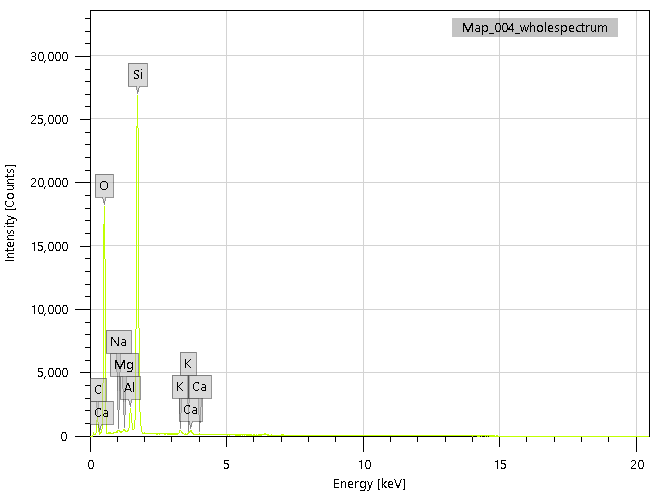
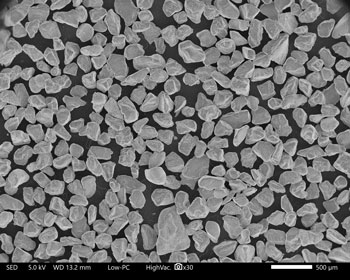
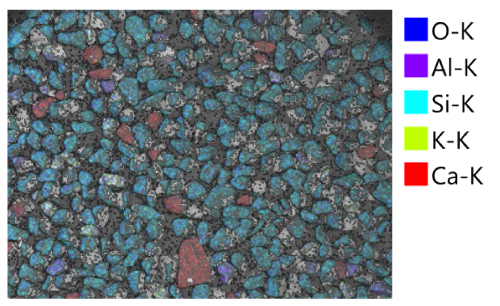
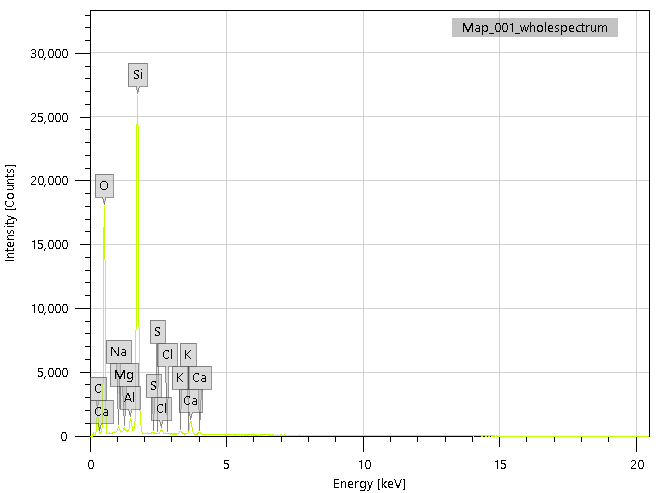
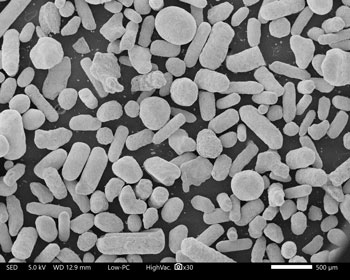
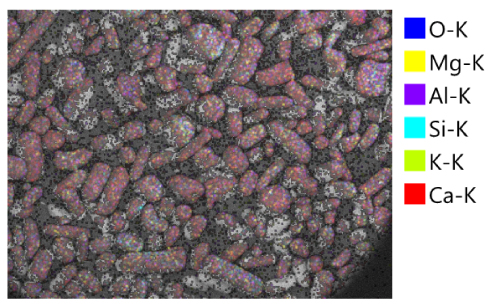
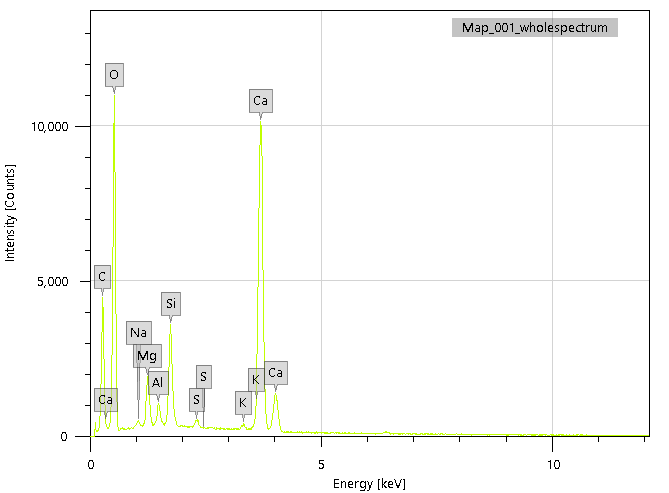
When imaging each sand sample, a low accelerating voltage and low probe current were used to get a detailed surface image. When conducting the elemental map trials, a high accelerating voltage and high probe current were used to get the most x-ray interactions and detailed x-ray maps.
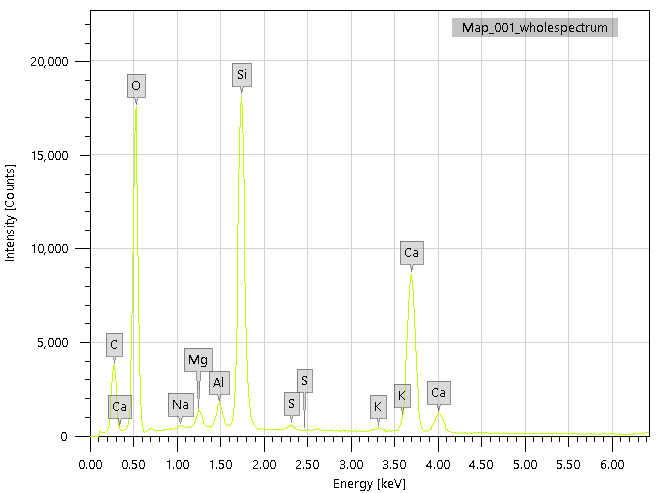
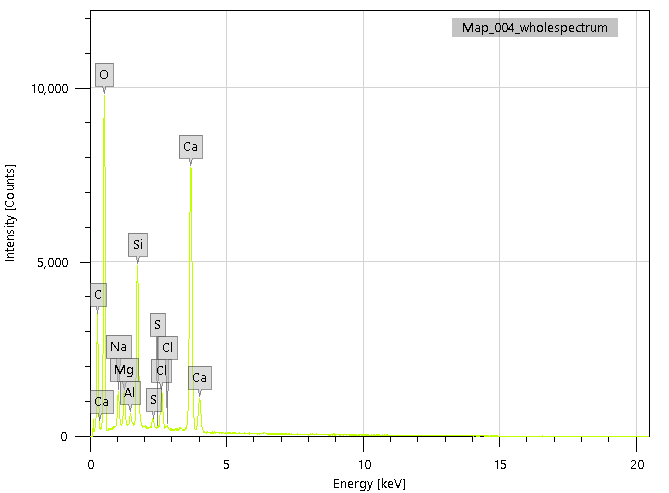
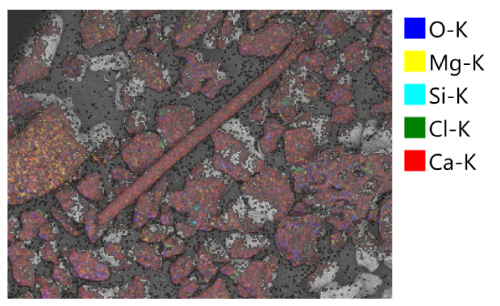
From the x-ray maps that the SEM generated, we were able to see differences between particular sand grains elementally, and compare these maps to the light microscopy images. When doing this, we could compare elemental differences to differences in color, texture, size, etc. with ease.
Below are the Sandbox requests by teachers, along with our electron microscopy contributions to improve this valuable resource.
Sand Request from Winters, Texas
This request came in from a person who is homeschooling their children and plans to use the Sandbox samples to allow the students to make microscope slide preparations and explore the makeup of the sand. Vocabulary words such as erosion, mixture, and deposition are also used in the lessons, along with teaching geography . The children will have to use a globe to pinpoint the location of each sand sample.
Djerba, Tunisia
Crete, Greek Island
Royère-de-Vassivière, Limousin, France
Volga River, Russia
Arabian Gulf, Bahrain
Sand Request from Cumming, Georgia, USA
Another homeschool teacher plans on using a microscope to make general observations on each requested sand sample and noting their differences in size, shape, and color. This teacher and their students are headed to the Outer Banks in North Carolina. They are looking forward to collecting some sand on their trip, and sending it in as a new sample addition to the Sandbox. We look forward to receiving their donation!
Yangtze River, Hubei Province, China
Republic of the Philippines
Seven Mile Beach, New South Wales, Australia
Tel Aviv, Israel
Great Salt Lake, Utah
In compiling the images for the Sand Gallery updates, it is always striking how unique each sand sample is when compared with others in the collection. The power of this collection is not only measured in the number of different locations represented, but also in unlocking and revealing the elemental data that chemically characterizes each sample. The photomicrographs, along with the corresponding elemental composition, puts a face on each sample in the collection, and allows the opportunity to provide valuable educational data not just for educators, but also for groups such as geologists, forensic scientists, and customs agents.
Do you like the new Sand Gallery format? Please let us know what you think in the comments.
Thanks for reading.
Comments
add comment