Micro Powder X-ray Diffraction in the Laboratory
Introduction
X-ray diffraction (XRD) has been the indispensable tool for identifying crystal phases. The most common use of the X-ray diffraction phenomenon is in powder diffraction instruments where several randomly oriented crystals in a small amount of powder are rotated in an X-ray beam. Rotations in several directions expose planes in the sample’s crystal lattice multiple times and produce distinct, detectable diffraction events particular to the sample.
Typical powder instruments use sealed tubes to generate X-rays. While these tubes are low-cost and easy to maintain, their X-ray flux can only analyze samples 100’s of micrometers in size in a reasonable timeframe because of the low probability of a constructive diffraction event being detected. For samples in the 10 micrometer size range, the long time needed (10’s of hours) to produce enough diffraction events to create a usable XRD pattern would not be practical. More X-rays are needed to increase the diffraction probability. Another option is to analyze the particle at a synchrotron source, also not cost-effective and most likely inconvenient.
These limits of particle analysis have been overcome at McCrone Associates, Inc. with the implementation of a Rigaku MicroMaxx-007 rotating anode source combined with the RAPID-SPIDER X-ray detector. The instrument has successfully analyzed particles as “micro-powder” samples down to 6 micrometers in size.
Sample Preparation
A focused X-ray beam requires that a sample be positioned precisely in its path. Powder diffraction requires that the sample must have rotation in at least one direction; using more than one rotation direction simultaneously is advantageous to allow as many crystallographic planes to be exposed as possible. The apparatus holding the sample must not be crystalline itself and it should not be a highly absorbing material; both qualities would interfere with the sample pattern.
Typical powder diffraction instruments mount particles on glass fibers too large for particles in the 10 micrometer size range. At McCrone Associates, our glass fibers are manufactured in-house by our cleanroom staff. The tip of a glass rod is heated to melting and pulled to form a thinner fiber approximately 5-10 micrometers in size (Figure 1).
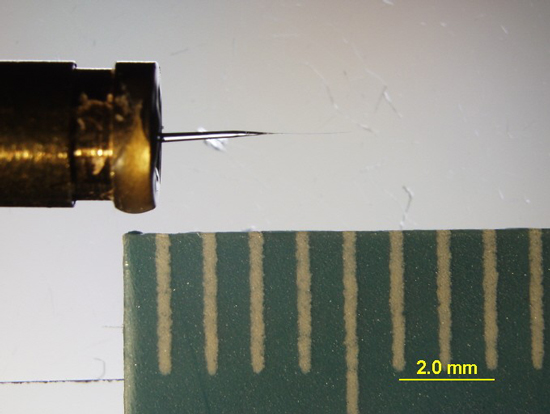
The particle to be analyzed is located in a stereomicroscope and adhered to the glass fiber with a small amount of soluble gum. Although these materials-glass fibers and soluble gum-seem simple, they are remarkably robust. Standards mounted on fibers over three years ago using this method are still in use today.
Although the majority of our samples are micro-size, two other major types have been analyzed. Particle samples or a group of particles that total a larger size (~50 to 100’s of microns) can be adhered to a MiTeGen® mount, manufactured by MiTeGen, LLC. These mounts are made of a polyimide polymer which has low X-ray absorbance and scatter (Figure 2).
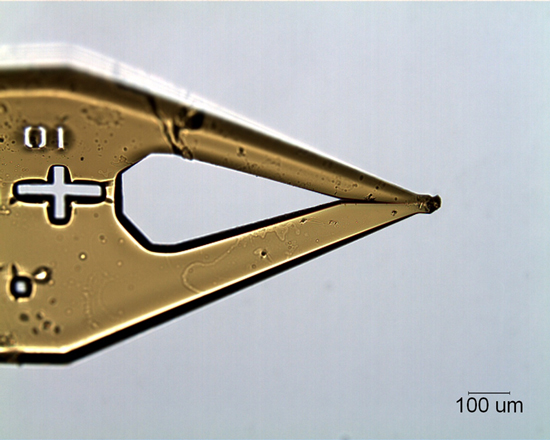
For many powder samples, the amount is in the microgram range, too little for a typical theta-2theta scanning instrument. We utilize 0.1mm inner diameter S-glass capillaries from the Charles Supper Company for limited powder samples (Figure 3). A small amount is placed in the funnel end of the capillary and the sample is vibrated or tapped into the narrow portion.
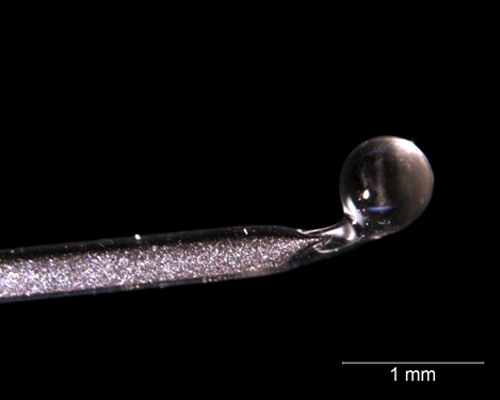
Although these capillaries have low X-ray absorbance, there is still some scatter; an empty capillary image is usually subtracted from the sample image to remove the scattered data.
The Instrument
The source is the Rigaku Micro-Maxx-007, a rotating copper (Cu) anode (Figure 4).
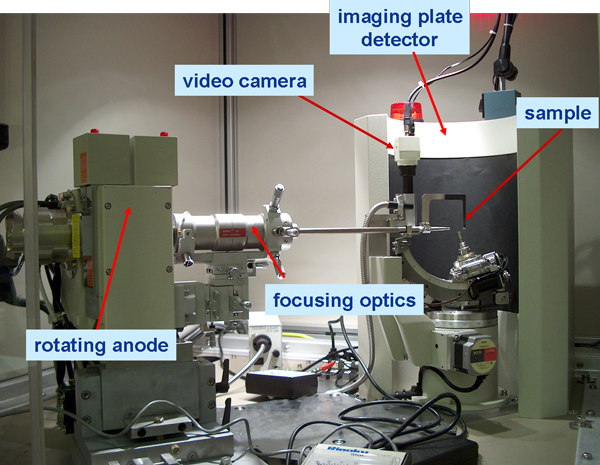
For all samples, the source is operated at its maximum power of 40 kV/20mA. The high-intensity source is focused using a series of focusing elements that are optimized by the operator. Once focusing is accomplished, the beam is collimated to a 100 µm spot coinciding with a ¼ chi-goniometer. A mounted sample secured in the goniometer holder can be viewed on a video screen via the center of a telescopic camera in the sample enclosure or on a computer monitor. The mounted sample, the goniometer center and the beam focus all need to coincide. The goniometer center is fixed while the focused beam must be brought to the same position as the gonionmeter center. The goniometer center is found and marked by adjusting crosshairs on the video screen with its position. When the beam is aligned it is also positioned at these crosshairs. For most particles, the sample is rotated continuously 360º in phi (plane parallel to beam) and a limited range (i.e., ± 5-10º) in chi (90 º to phi). Rigaku instrument software is used for goniometer movement and exposure time.
Diffracted X-rays interact with a “filmless” imaging plate detector 127.4 mm from the sample. When the analysis is complete, the entire plate is automatically moved below the sample area and read by a laser in less than one minute. This data is transferred to a computer and the image is read by Rigaku software and translated to a typical 2-theta versus intensity plot.
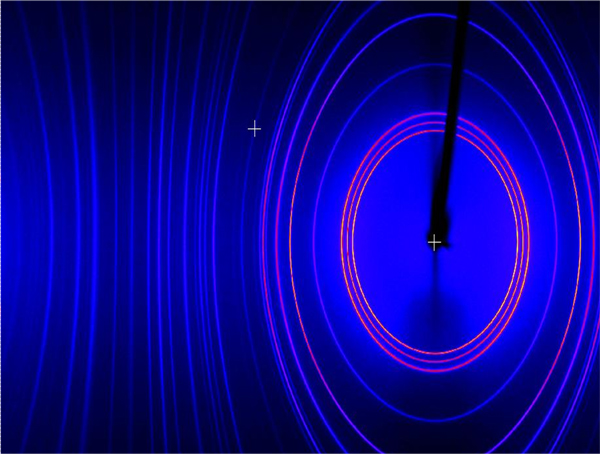
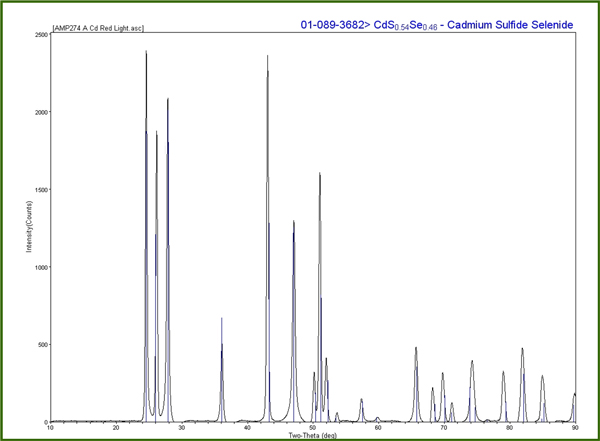
The plot is loaded into MDI JADE 9.0 software for pattern processing. JADE is connected to the International Centre for Diffraction Data (ICDD) database for comparison of the sample pattern with standards in the database.
Standards
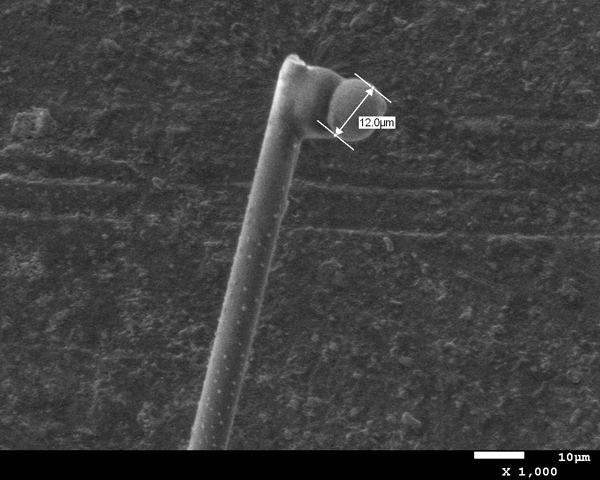
Standards were first tested to evaluate the efficacy and limits of the micro-XRD. An S-glass capillary packed with a corundum powder (Figure 6), a 50 µm nickel wire (Figure 7), and 5-15 µm nickel spheres (Figures 8A and B) were tested. The wire and powder only required 2 min of exposure to obtain a clear pattern. The nickel sphere mounted on a glass fiber was measured in the scanning electron microscope (SEM) to be approximately 12µm. This sample was exposed for 5 min and clearly showed the diffraction pattern for nickel metal.
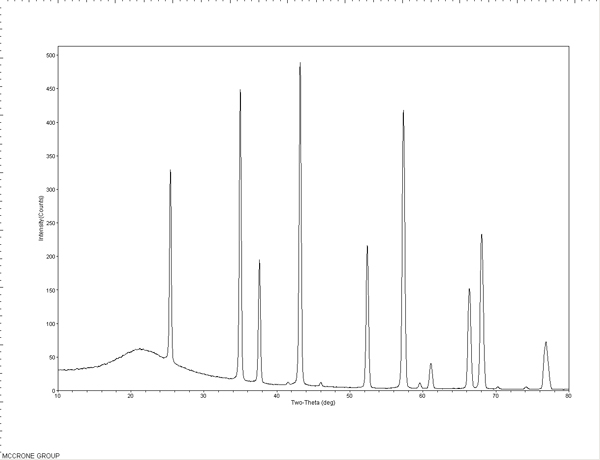
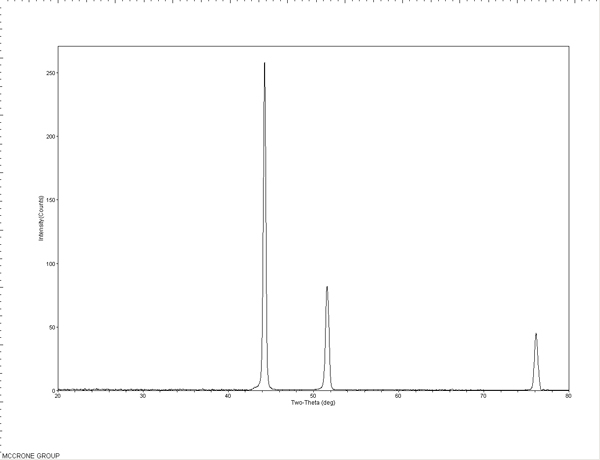
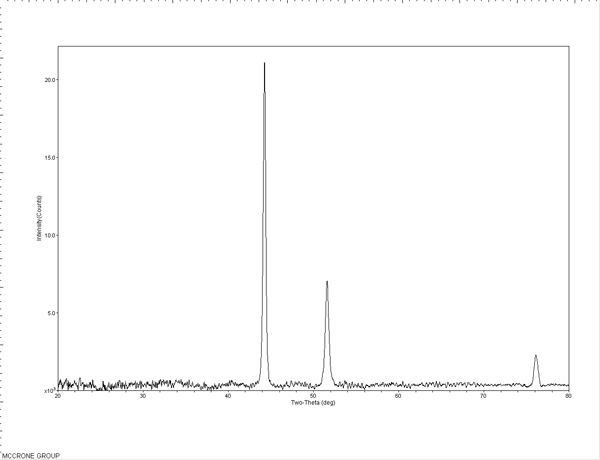
The standard patterns are used to perform a theta calibration on the MDI JADE 9.0 software to account for the sample position relative to the detector and the predetermined beam position. This calibration is used with subsequent patterns to accurately position the peaks in 2-theta. The packed powder and wire samples can also be used to check the nickel theta calibration or used to create calibration curves themselves.
Test Painting Samples
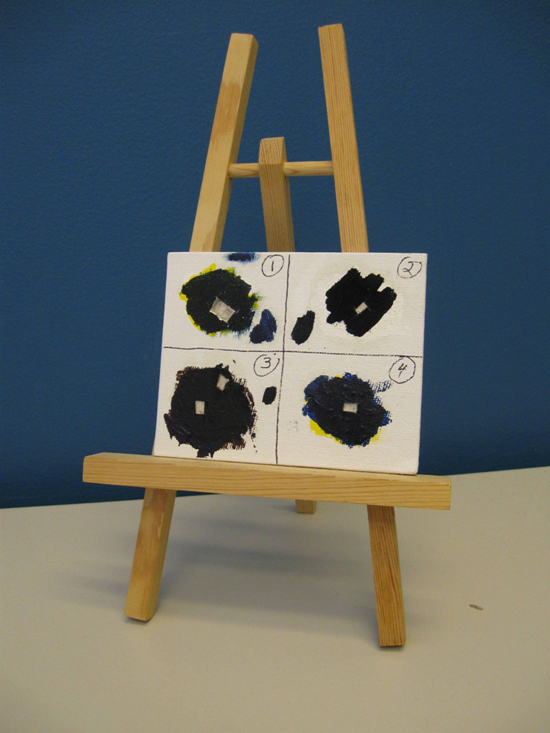
The ability to analyze micro samples by XRD in less than 10 minutes opens up a range of possibilities to identify the phase of samples that otherwise would have only elemental data. A painting composed of a few layers of commercial paints in varying pigments and media was created (Figure 9).
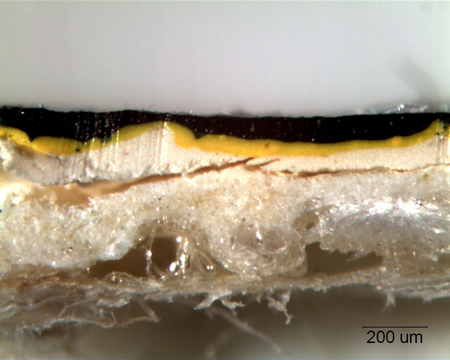
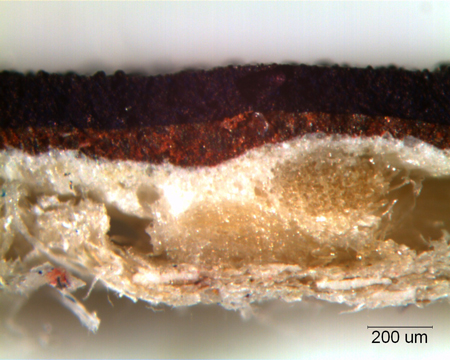
Cross-sections were removed from these layers and particles from each layer extracted and mounted for micro-XRD. The first two cross-sections removed each contained three layers of paint (Figures 10A and B).
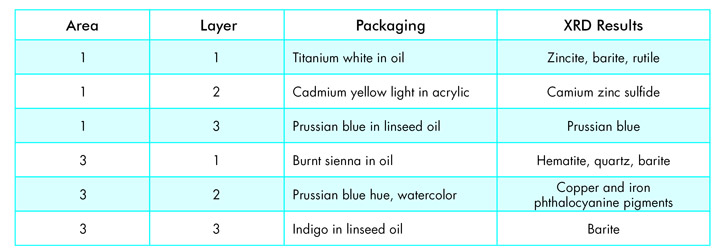
A particle ~50 microns in size was removed from each layer and analyzed by micro-XRD using a 10-minute exposure. Table 1 shows the listed composition from the paint packaging compared to the XRD data.
In most cases the major component was the indicated pigment; a few contained fillers such as barite. The data illustrates the micro-XRD instrument can easily detect multiple phases in micro samples. In addition, having only elemental data for many of these compounds would make phase identification ambigious; detection of titanium could be one of two common pigment compounds, rutile and anatase, while iron could be a host of oxides. The data from the micro-XRD definitively identifies which compounds are present.
The Rigkau micro-XRD instrument used at McCrone Associates has proven to be an invaluable tool for phase identification of samples that would otherwise have to rely on elemental data alone. The instrument has been useful in identifying the phase of pharmaceutical contaminants, circuit board corrosion, and metallic and glass surface contamination particles from a variety of samples.
Do you have questions regarding your materials? Speak to a scientist.
Comments
add comment