Microscopical Evaluation of Glass Delamination In Pharmaceutical Vials: A Look at Three Different Vial Manufacturers
Delamination is defined as separation into constituent thin layers (lamellae). Glass delamination, which can have several causes, could then be defined as a separation of surface glass, as from a vial, into thin layers resulting in a flaky appearance. Pitting could be related to, or even be the initial stages of glass delamination; data will be provided that supports a relationship. The presence of glass delamination is a serious concern to the pharmaceutical industry, not only because suspended glass flakes in any pharmaceutical product poses an obvious health hazard, but because of regulatory quality control standards, and medical profession requirements.
There are, of course, many ways of addressing the problem of glass delamination in pharmaceutical vials, including looking into the relationship of chemical nature of vial contents to degree of delamination and conditions of vial manufacture. Specialized lighting and imaging methods are other research approaches. The results from the present microscopical study, although confined to the vials of only three different manufacturers, indicate support for the theory that pitting may be the precursor or early indicator of full-scale glass delamination.
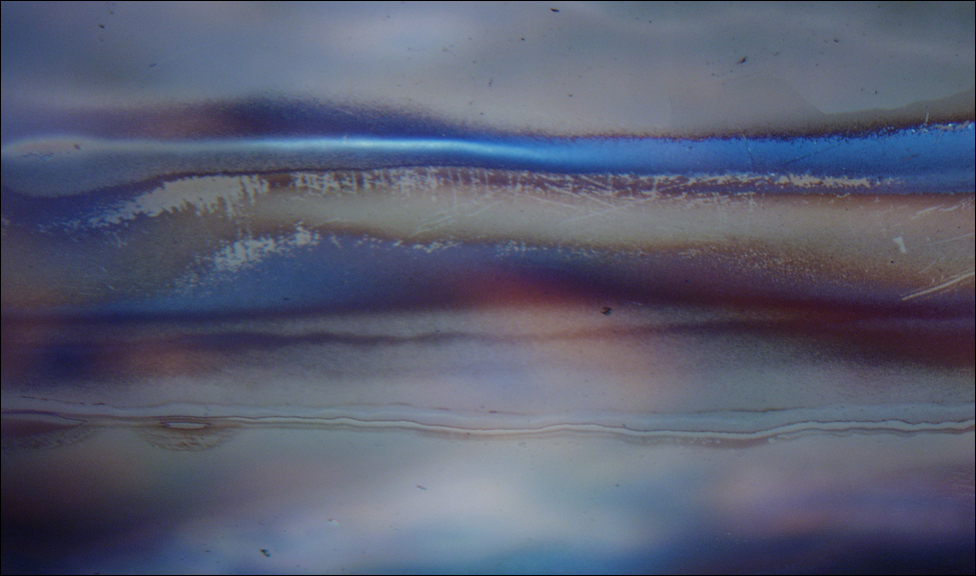
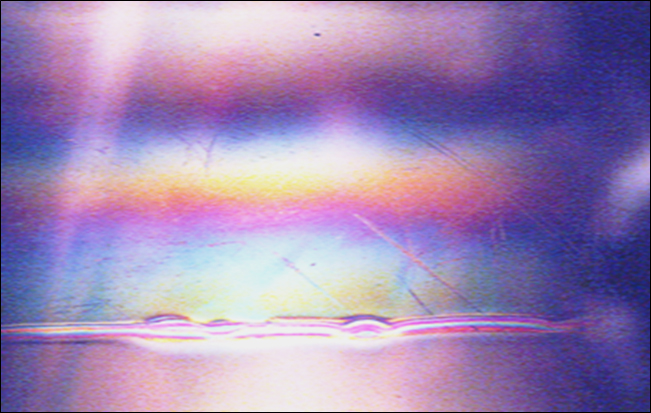
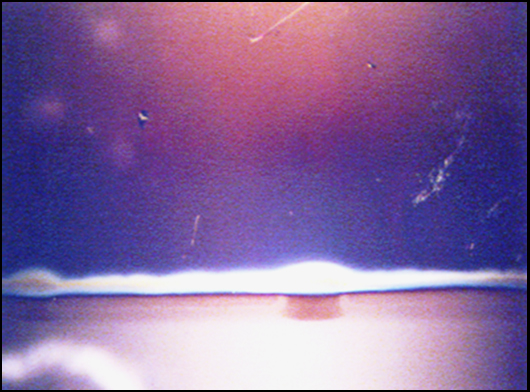
As already suggested, glass delamination in pharmaceutical vials can occur during manufacturing of the vial, e.g. fusion at the neck or base, where delamination and/or pitting are frequently found; or by adverse reaction to the vial contents, e.g. etching due to an acidic or basic solution, or one with a high sodium/salt content. Solution-filled vials often show delamination at the fill line. For analytical purposes, therefore, such suspect vials should be left filled and not sent empty. From the standpoint of the microscopist this point must be emphasized. In the past we have been obliged to speculate a fill-line delamination in an empty vial based on previous experience with fill-line delamination problems. Filled vials are vastly preferred by analytical microscopists because such fill lines can be recorded, and, most importantly, the contents can be filtered under cleanroom conditions, in order to concentrate and study the glass delamination. Figure 1, for example, is a reflected-light photograph of delaminated glass recovered on a polycarbonate membrane filter; the brown colored flakes seen in the photo are thinner.
McCrone Associates received a project from a pharmaceutical company that requested comparison in the amount of glass delamination from three different glass vial manufacturers. The vials were received empty, but had previously contained the product (except for one reference vial); the product was described as strongly basic. All vials were subjected to the same temperatures and time studies documented and provided by the client. Figure 2 shows the areas of a glass vial that will be referred to when delamination and pitting are found. All photomicrographs were taken in reflected light.
For confidentiality purposes, the manufacturers will be referred to as Company A, B, and C. In addition to determining the amount of glass delamination, further analysis was requested for Company B only, due to an unusual vertical-striation appearance. The first set of three vials represented all three manufacturers and were identified as having been kept at 55˚C for a two week period. The second set of vials represented Company B and were identified as having been kept at 40˚C, 30˚C, 25˚C, and 4˚C respectively for a four week period. The third set was Company B only, and identified as having been kept at 40˚C, 30˚C, 25˚C, and 4˚C respectively for an eight week period. In addition to these client supplied vials, we requested for our own research purposes vials from Companies A and C that had been kept at 40˚C, 30˚C, 25˚C, 4˚C for a four week period.
The findings of the first study revealed pitting in vials from all three companies (pitting can be seen in the flakes in Figure 1). Company A’s pitting was at the base of the vial; Company C’s was at the base, and fine pitting was found at the neck; Company B’s pitting was found throughout the vial. Delamination was definitely present in the vials from Company A and C; both delamination bands were common to what was believed to have been the fill line. Company C’s delamination is closer to the base of the vial, because the vial was larger than A and B; it could be assumed the vial is filled with the same amount of solution. Company B had two horizontal rings of defects that were not positively identified as delamination. Something not commonly seen was vertical striations down the entire vial, and brown residue within the striations. Analysis will provide results of these findings.
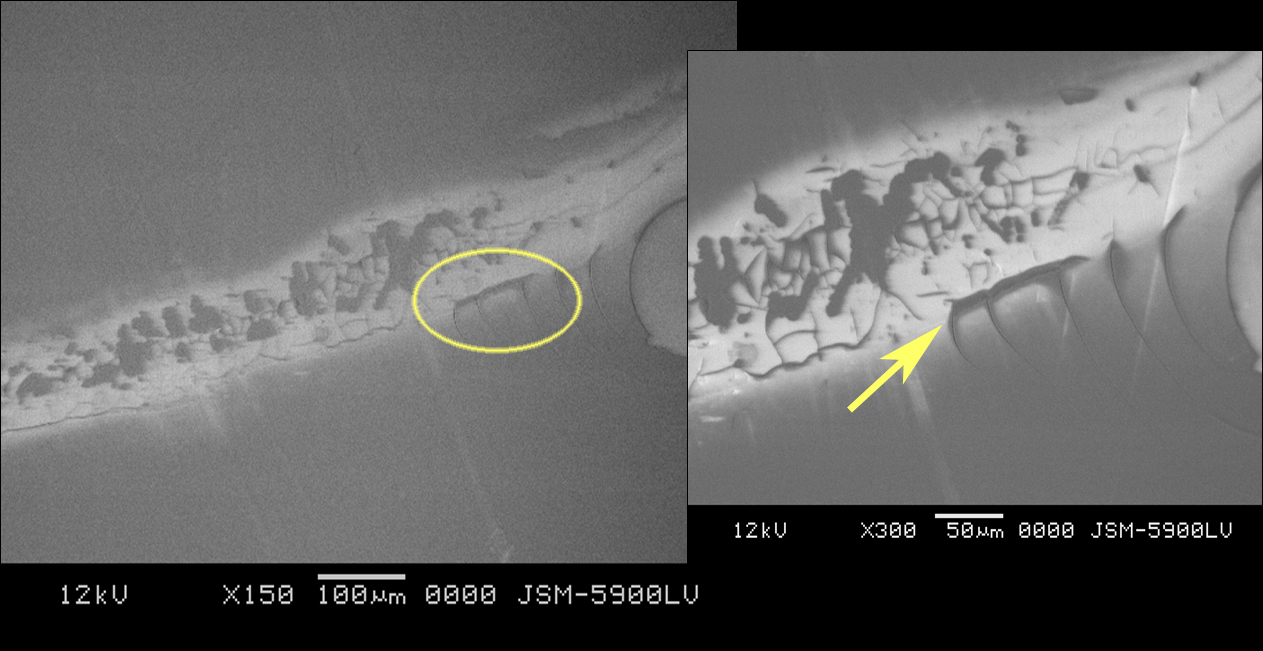
Figures 3 and 4 show delamination and pitting for Company A’s vials. There is a dark pink/brown residue below the delamination band; and there is pitting at the base of the vial which could be a thinner area of delamination. Scanning electron microscope (SEM) images show delamination (Figure 5) and pitting (Figure 6); a flake and a piece flaking off can be seen in Figure 5: pitting can be visualized going beneath the surface (Figure 6).
The pink/brown residue seen in Company A’s vials was isolated for infrared spectrometry (IR), along with delamination flakes, to see if there was a similarity between them so as to be able to conclude whether or not the residue could be delamination. X-ray photoemission spectrometry (XPS) was also used to compare the delamination and residue. All IR spectra show the broad band at ~1100λ which is characteristic of silica, suggesting glass. We can conclude from this information that the delamination and residue are similar.
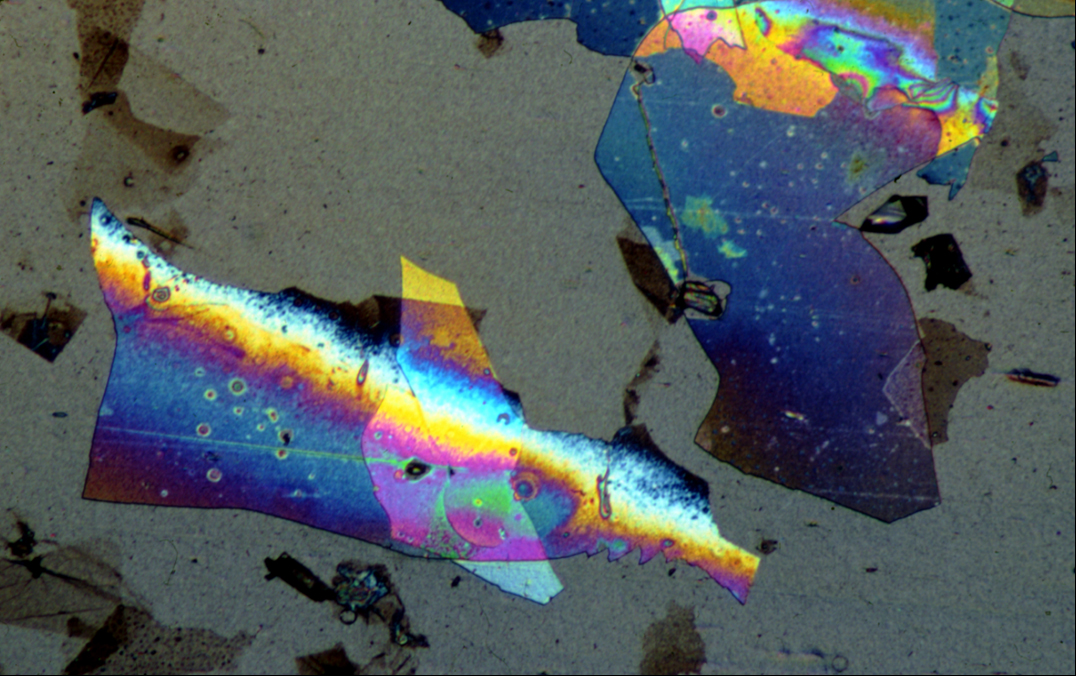


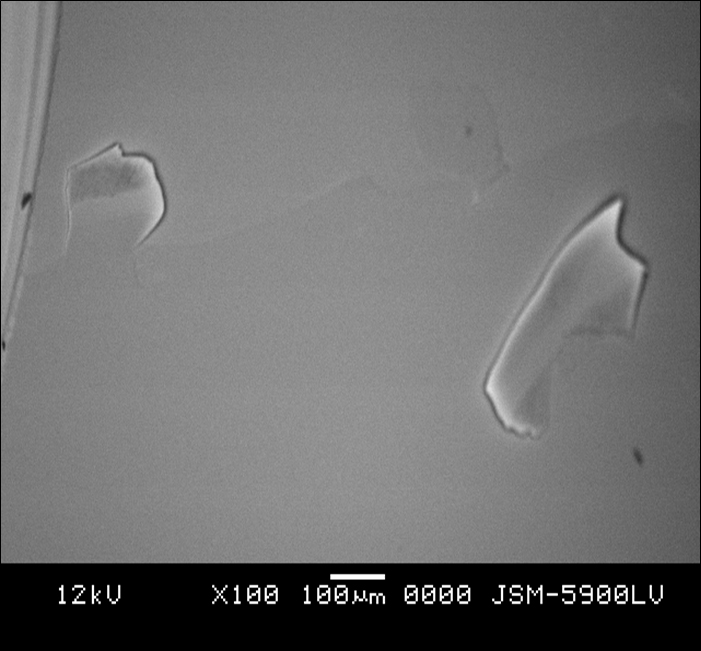

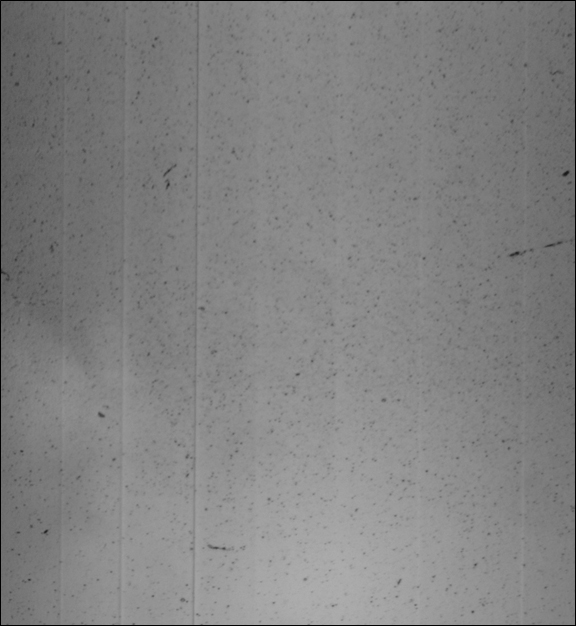
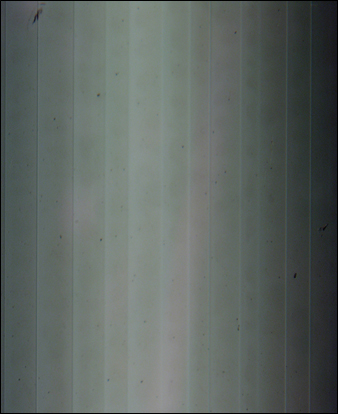
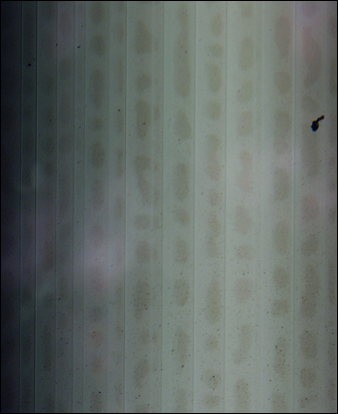
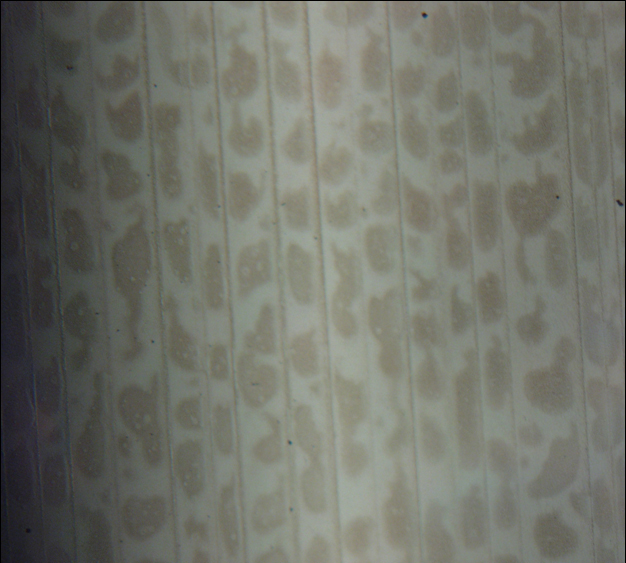
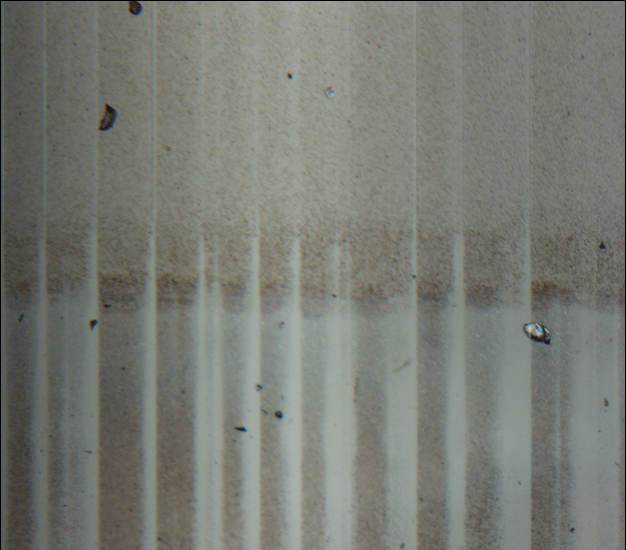
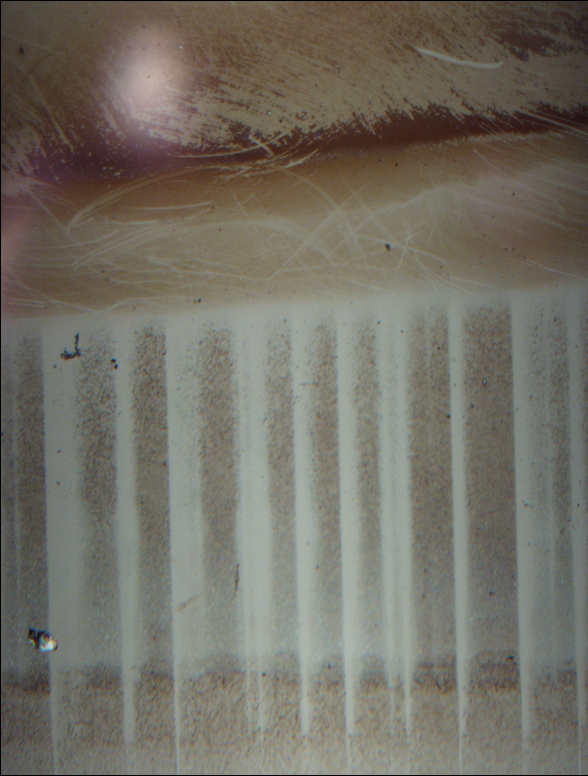
Figure 7 shows the striations and pitting from company B’s strange striations. Figures 8 and 9 show the striations and the brown residue within the striations. Figure 10 shows that the “defects” of company B’s vials are very similar to the delamination bands of the other companies vials. They look slightly different, and were at the very neck region of the vial, possibly the fill line. No IR spectrum of this delamination was obtained because a representative sample could not be removed.
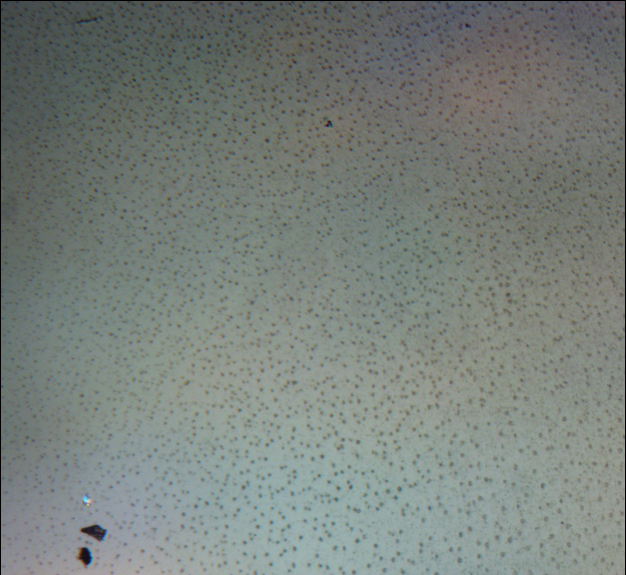
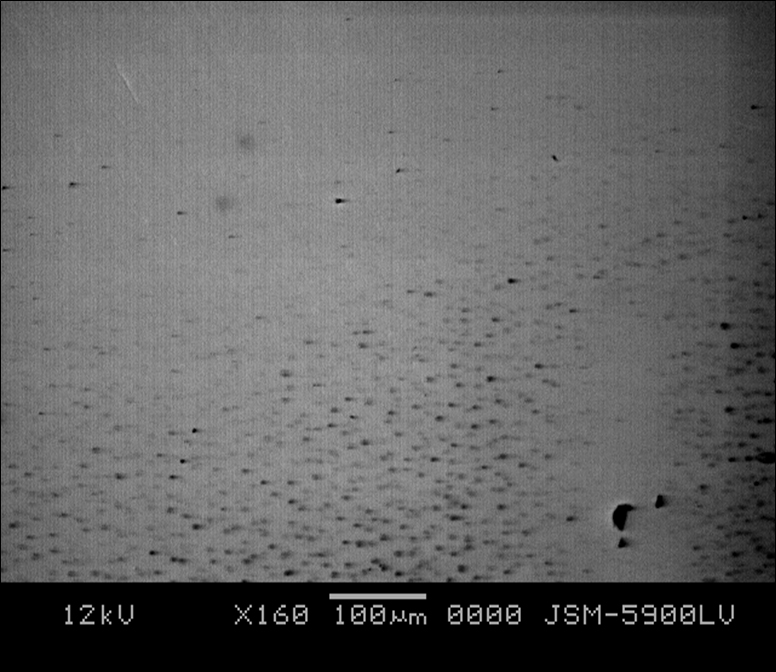
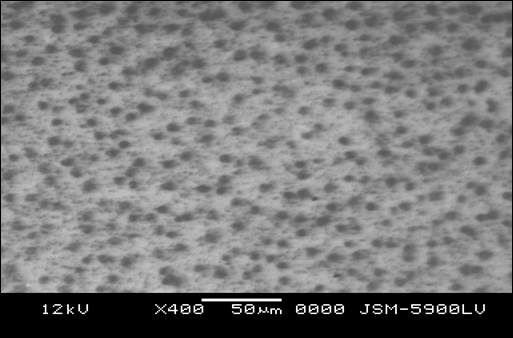
Figure 11 shows large pitting at the base of Company C’s vials and Figure 12 shows finer pitting at the neck.
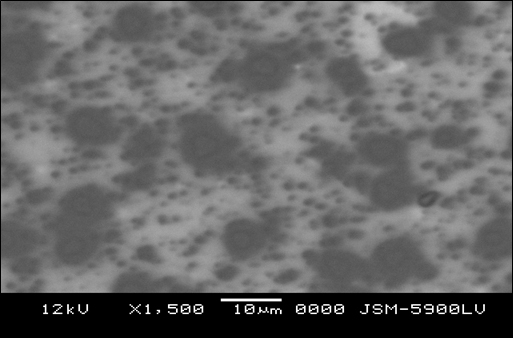
SEM images were also taken to show tapering of pitting and the enlargement of pitting (Figures 13, 14, and 15).
Delamination is shown in Figure 16. If the whitish line is focused on, the SEM images shown in Figure 17 provide detail on a close up of the delamination and the flakes starting to slough off. Again, an IR spectrum was obtained to show a ~1100λ band which is a characteristic of silica; again, suggesting glass.
The second study consisted of four vials having been kept at 40˚C, 30˚C, 25˚C, and 4˚C respectively for a four-week period. Company B’s vials were sent by the client for further analysis. Company A and C’s vials were sent for research purposes.
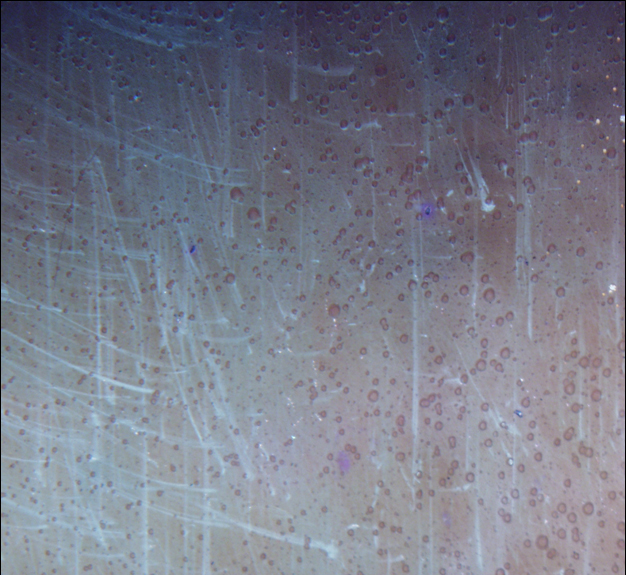
Company A’s vials resulted in pitting at the base of the vial at all temperatures and finer pitting was in the neck area, as seen in Figure 12. Delamination was found ~1/2 inch from the top of the vial; this area is common to the fill line. The pinkish residue is seen but only at 40˚C. Again, this residue is believed to be thin delamination.
Company B’s vials, which were sent in per client request, contained pitting at all temperatures except 4˚C. There was no delamination found. The strange vertical striations were visible again at all temperatures along with the residue/discoloration between the striations, similar to the first study. A reference vial was sent in which only showed very faint striations.
Company C’s vials again were sent in for research purposes only. Pitting was found at every temperature, but only at the base of the vial. Pitting was found at 4˚C. Delamination was common ~3/4 inch from the bottom at 40˚, 30˚, and 25˚C. Company C’s vials were larger than the other companies; we could then assume that this is still common to the fill line. There is some minor delamination over the pitting at the base of the vial at 40˚C. Apparently, as these results show, as temperature increases, delamination increases.
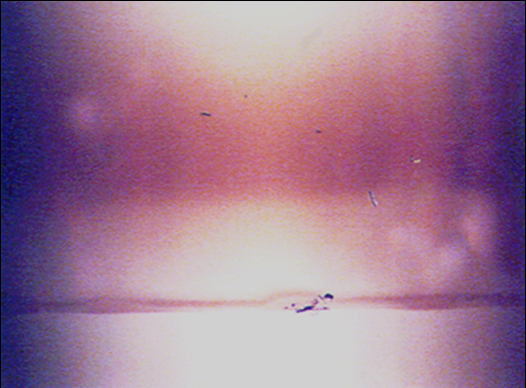
Figures 18, 19, and 20 respectively, show how delamination increases when temperature increases from Company A’s vials.
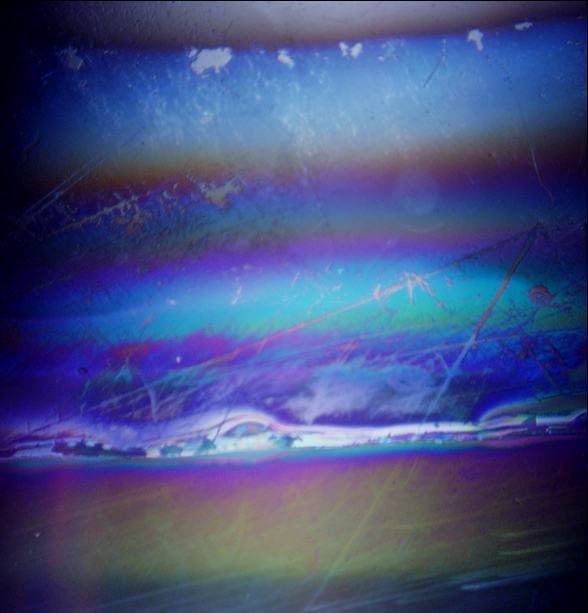
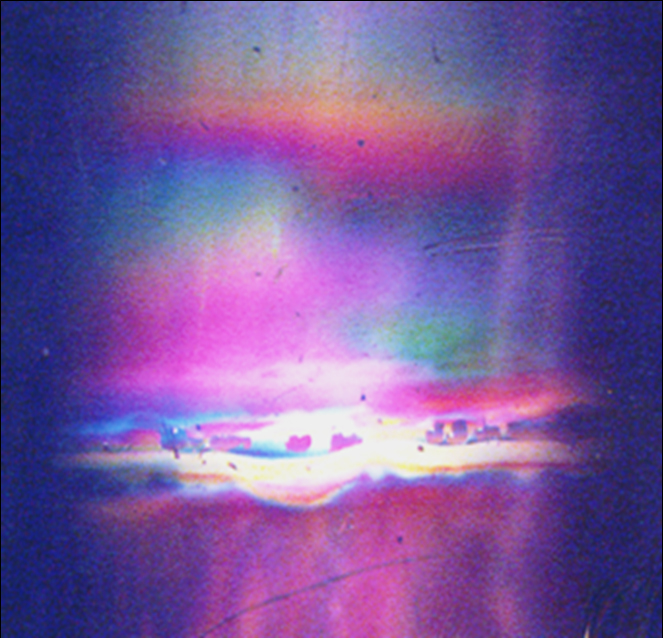
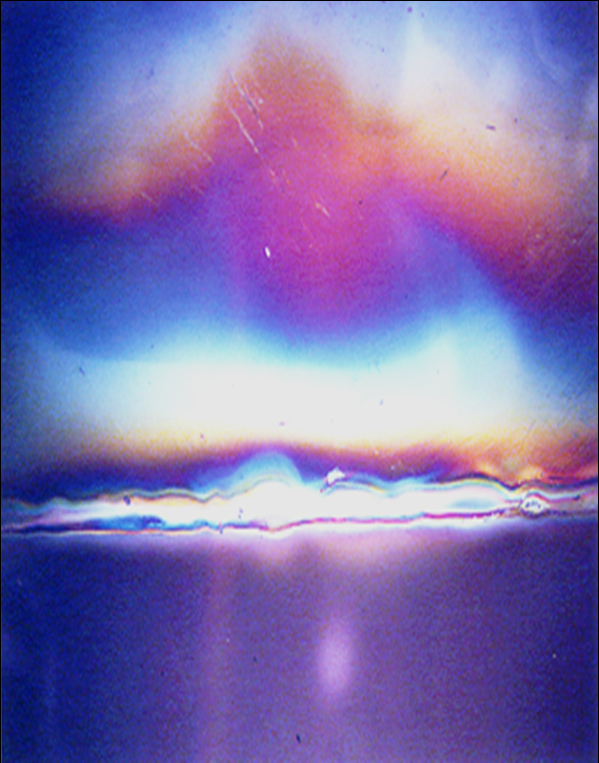
The increase of delamination with an increase in temperature from Company C’s vials is shown in Figures 21, 22, and 23. A thinner brownish color “delamination” is seen in 25˚C (Figure 21). There are more colors seen in 30˚C (Figure 22) and a blast of color in 40˚C (Figure 23).

A third study involved four more vials from Company B which had been kept at 40˚C, 30˚C, 25˚C, 4˚C respectively for an eight week period. Further analysis was requested by the client. To recap, the four week period had pitting at every temperature except 4˚C. There was no delamination, but there were striations with the discoloration in between. At the eight week time period pitting was seen at the base of all vials except at 25˚C, where no pitting was seen. The only temperature with pitting at the neck of the vial was at 40˚C. Delamination was seen only at 40˚C and 30˚C. Discoloration and striations were seen on every vial. There was no discoloration found on 25˚C, which corresponds to the four week period where there is some discoloration and faint striations. Results show again as temperature and now as the time period increases (from 4 weeks to 8 weeks), the more prevalent delamination becomes.
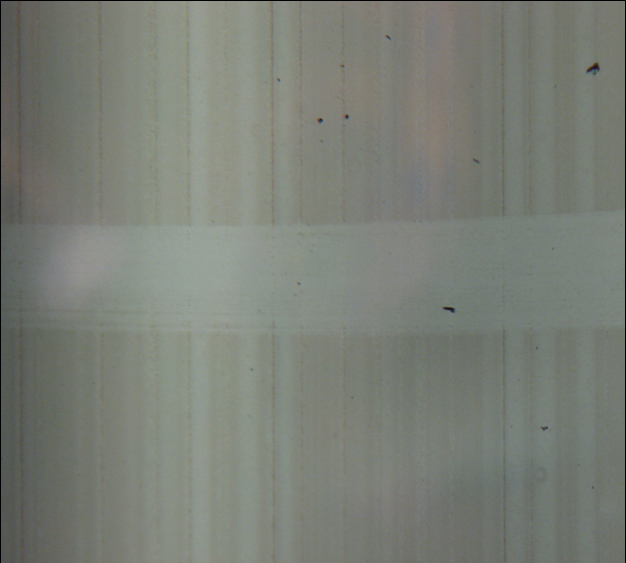
Figures 24, 25, 26, and 27 show the striations and discoloration from Company B’s vials; the eight week period shows more developed striations and discoloration than the four week period. Figure 25 shows an area with a clear space between the striations; it is possible this area was common to where the fill-line would be.
X-ray photoemission spectrography (XPS) was used to analyze the surface of several pieces of the companies vials to determine delamination. Using XPS, one obtains a surface analysis of the outermost 1-5nm of a solid sample. An atomic percentage was measured for carbon, oxygen, silicon, aluminum, sodium, calcium, magnesium, nitrogen, and other trace elements (<0.5%) for each sample. Only vials of Company A and B were analyzed by this technique. The results show that many of these vials are delaminating.
From table 1, findings show: sample 10 is a reference (clean) vial from Company B which was unexposed to the drug; sample 5 is from Company B (4˚C/4 week) that was a clean area of the vial, but had been exposed to the drug; samples 1-6, and 9 are from Company B; samples 7 and 8 are from Company A.
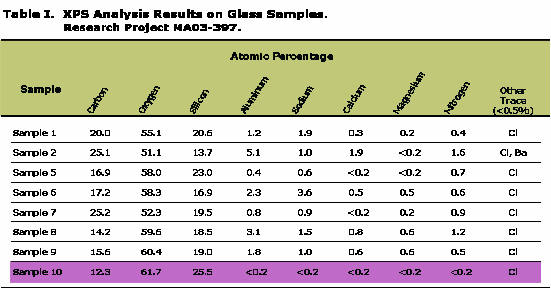
The highlighted band in Table 1 is the reference vial (Sample 10). In comparing the other samples to sample 10, results indicate that the atomic percent of the more soluble elements (Na, Ca, Mg) associated with glasses were high from the norm, while silicon was low from the norm, which could be related to glass delamination exposing fresh glass. Another significant change is that carbon is going up and oxygen is going down, which is likely an organic residue.
Samples 1 (30˚C/4 week) and 2 (40˚C/8 week) had the brown residue. This was difficult to determine, but since carbon and the more soluble elements go up and oxygen and silicon go down a possible result could be residue from product or cleaning.
Sample 6 (25˚C/4 week) has the striations; the more soluble elements are high, which suggests delamination exposing fresh glass. It is possible that the striations were there in manufacturing and etched away more with increasing time and temperature.
Sample 9 (55˚C) results suggest delamination.
Samples 7 and 8 (55˚C) have the dark and pinkish residue which seems similar to delamination; these results suggest delamination.
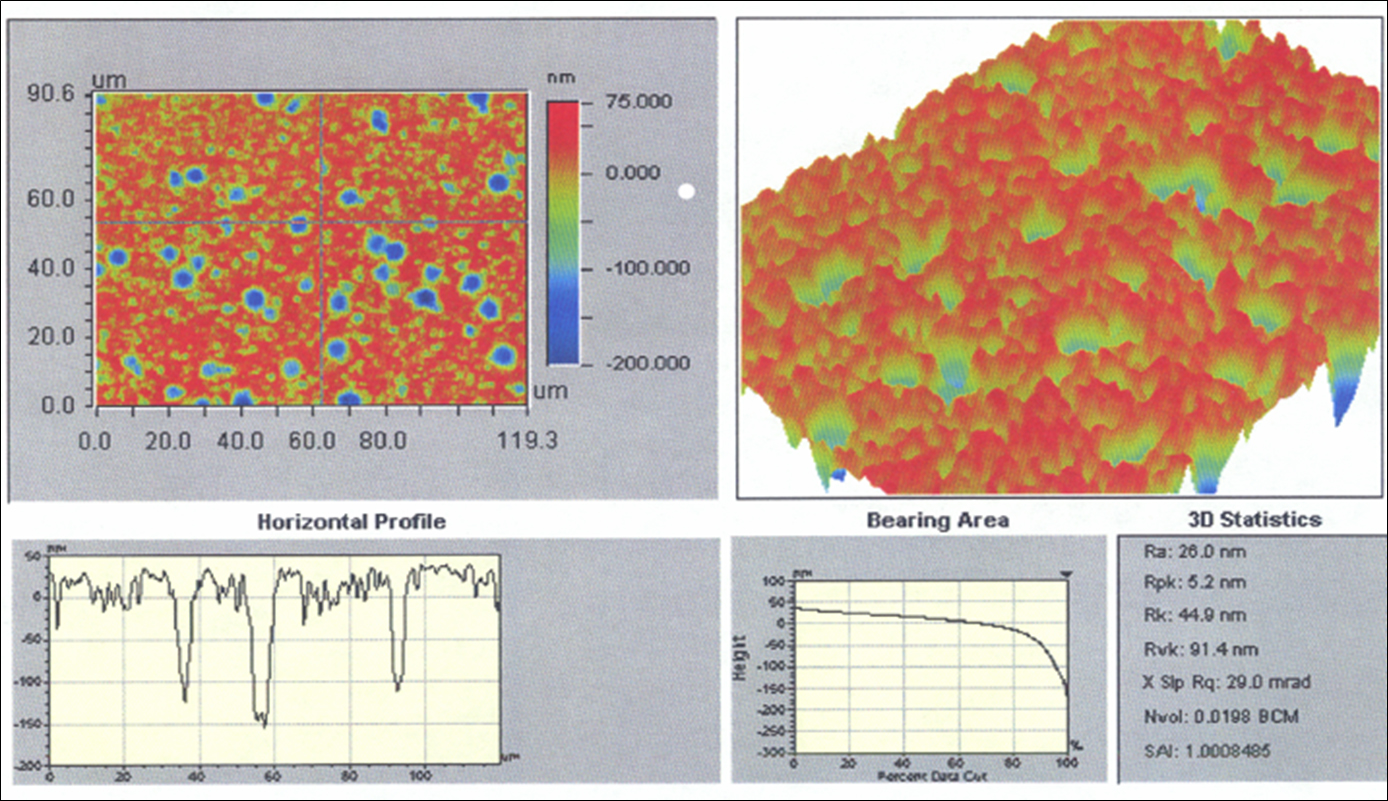
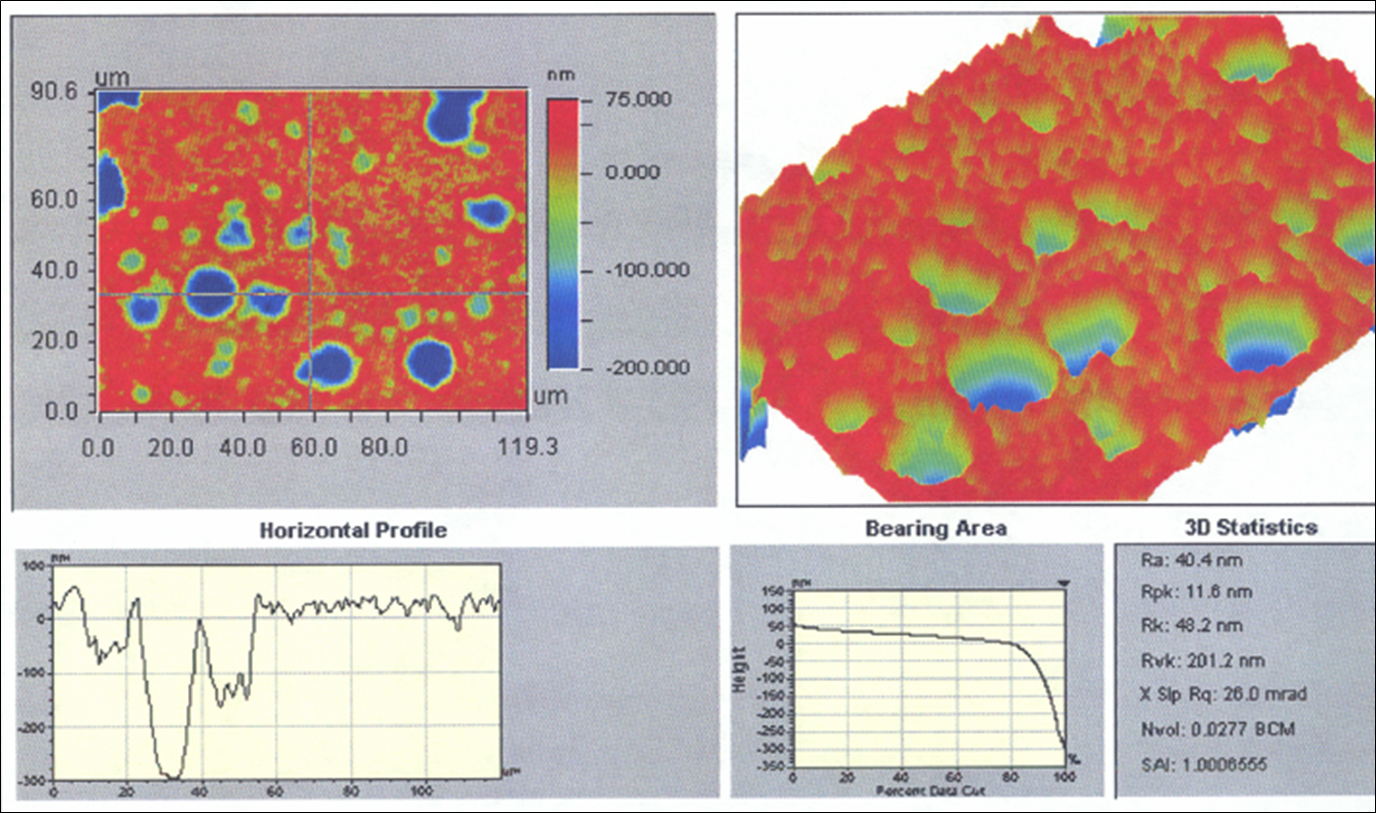
Can pitting constitute delamination? We have learned pitting occurs frequently and is common with delamination flakes. A vial not related to these studies, but of similar type, was sent out to a company that measures 3D surface texture. Their definition of surface texture measurement is derived from a measurement of the heights of the various image points. The following pictures show parameters and profiles of pitting on the vial’s base, neck, and center. Figure 28 shows the base area of the vial. If the X and Y axes are visualized, they cross over certain pitting along the surface. The blue area is a larger pit which results in ~100-200nm on the colored scale and then in the horizontal profile it can be determined that the depth is ~150nm. If the whole picture is looked at, the 3D image shows the blue areas spiking down from the surface.
Figure 29 shows the base of the vial again with everything a lot clearer. This picture shows a larger pit and the horizontal profile shows more depth and again a stronger 3D image. We can speculate that as these pits grow larger and/or appear in greater number, they can begin to form a flat surface resulting in the flaky appearance that becomes glass delamination.
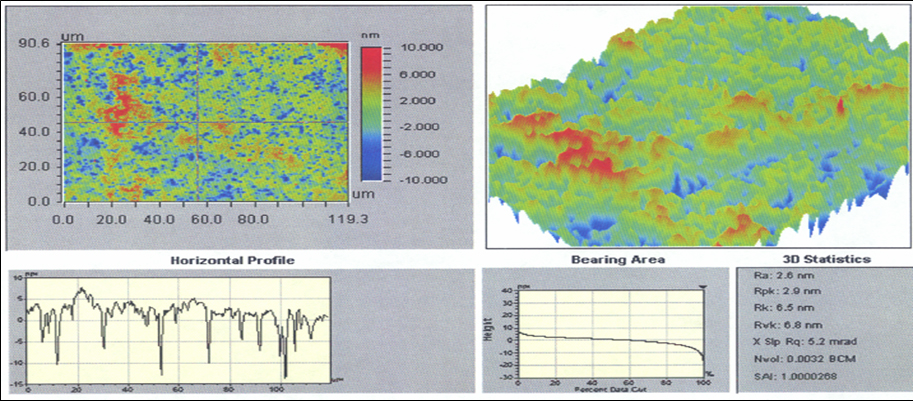
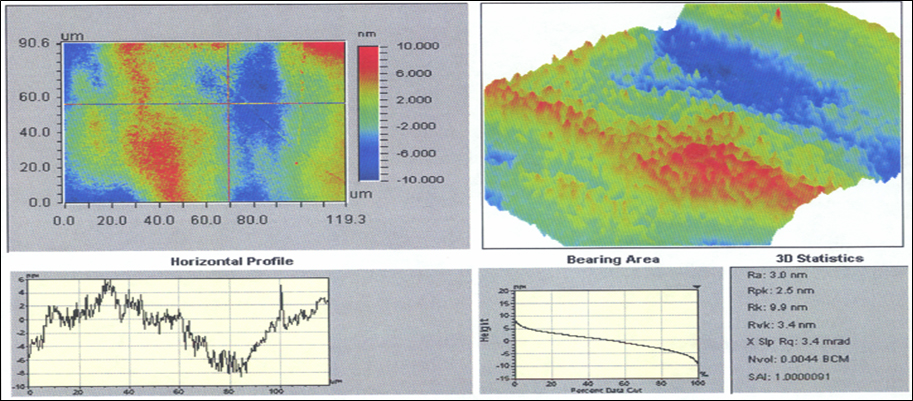
Figures 30 and 31 show measurements from the center and neck of the provided vial; both seem to have fine pitting. The data from these diagrams of surface texture measurements suggest a relation between pitting of a vial and glass delamination of a vial.
In summary, time and temperature studies provide good evidence that as time and temperature increase delamination increases. There is a correlation between delamination and the type of drug the vial contains; and another correlation of delamination occurring in the area that is common to the fill-line. These correlations can be more readily determined when vials contain the drug solution so that they can be looked at, recorded, and filtered under cleanroom conditions. XPS results infer when delamination occurs; silicon goes down while the other soluble elements go up exposing a new layer of glass. There are also significant changes from a clean unexposed vial to an exposed vial. Pitting is still questionable, but common, when delamination occurs and surface measurement analysis provides positive data.
A special thanks to McCrone Associate staff members, Scott Stoeffler for the SEM images and IR data, Kent Rhodes for the XPS data, and Mark Bukantis for the surface texture measurement information.
See also:
Is Your Product Stable in the Glass Packaging Selected for Use?
Comments
add comment