SEM/EDS Analysis for Problem Solving in the Food Industry
Abstract
For forensic investigation in the food industry, scanning electron microscopy (SEM) in conjunction with energy dispersive X-ray spectrometry (EDS) is a powerful, often non-destructive, instrumental analysis tool to provide information about:
- Identification of inorganic (and some organic) materials found as foreign contaminants in food products returned by consumers or detected during quality control inspections in the production facilities
- Identification of wear particles found in production lines
- Distribution of materials within a matrix
- Corrosion and failure analysis of production equipment
The identification of materials by SEM/EDS is accomplished through a combination of morphology by SEM imaging and the elemental composition of the material by EDS. Typically, the EDS analysis provides a qualitative spectrum showing the elements present in the sample. Further analysis can be done to quantify the detected elements in order to further refine the material identification. Metal alloys can often be differentiated even within the same family such as 300 Series stainless steels. Glass types can be identified by the elemental composition where the detected elements are quantified as the oxides of each element. In this way, for example, common window glass is distinguishable from insulation glass used in many ovens.
Wear particles or fragments from breakage can find their way into food products. SEM/EDS analysis of the materials is an important resource to utilize when trying to determine the original source. Suspected source materials can then be sampled for comparative analysis. EDS X-ray mapping is another tool that is available to provide information about the distribution of materials within a matrix. For example, the distribution of inorganic ingredients in a dried food helps to provide information about the grind and blend of the materials.
1. Introduction
Contamination of food products by foreign materials has been a continuing issue for many decades and is unlikely to be entirely eliminated. Contamination can be found from many sources, such as, the packaging, raw materials, production equipment, distribution sites (restaurants, stores, food stands), and consumers. Although the food industry and related industries are very proactive to prevent contamination by foreign materials, incidents still occur that often require major recalls and occasionally result in consumer injury or illness.
Analytical chemistry technology and instrumentation testing have made considerable advancements within the past 20 years. These advancements have allowed for analysis of foreign materials identification and characterization ranging in size down to submicrometer realms. SEM/EDS analytical microscopy is one of the methodologies that has seen significant improvements for analysis of microscopic sized particles. To demonstrate the advantages of SEM/EDS microanalysis a series of seven case studies from food industry projects are utilized:
- Glass fragments from a bakery product
- Metallic fragment from bagel dough
- Fractured steel filling tube
- Orange/brown stains under steel food can internal coating
- Multi-layer plastic pouch heat seal failure
- Metal wear particles from a powder seasoning
- SEM/EDS elemental mapping of a dry dog food pellet
Note that all of the quantitative EDS elemental data presented is semi-quantitative weight percent (wgt%) and normalized to 100%.
2. Case Studies
2.1 Glass fragments from a bakery product
Two glass fragments were submitted as shown in Figure 1:
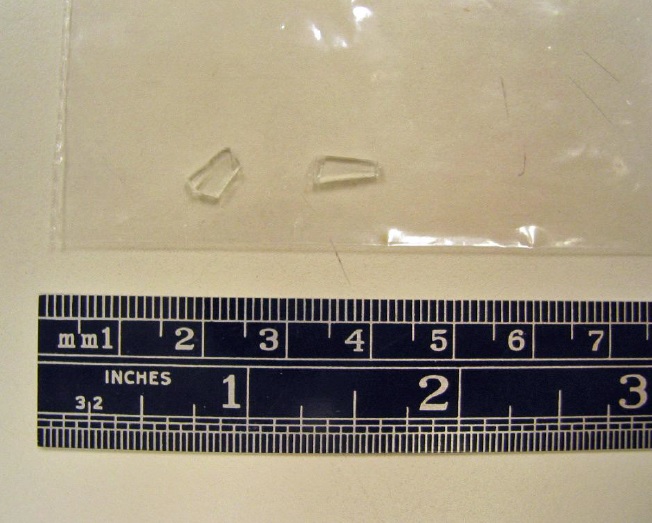
The glass fragments were smooth on both sides, indicating that they represented the full thickness of the original parent glass. A flat anvil micrometer was used to measure the glass thickness of approximately 0.046”, which is much thinner than typical bottle glass, single pane window glass or picture frame glass. The SEM/EDS analysis of both pieces revealed very similar elemental compositions shown by the representative data in Figure 2:
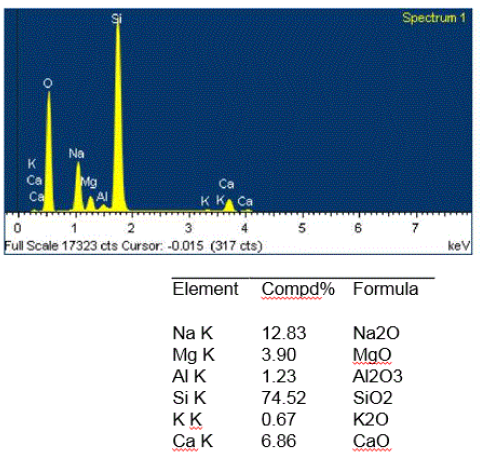
Glass compositions are normally reported as the oxide compound weight percent for each element. The composition of the glass fragments is typical of soda lime glass, which is a very common glass type. The one element that stands out is magnesium (Mg) at about 4% as MgO, which is a typical magnesium content of tableware glass. The thickness of the glass combined with the elemental composition information indicates tableware glass as a potential source of the two glass fragments.
2.2 Dark speck from bagel dough
The submitted portion of the dough containing a dark speck on the surface was given to a cleanroom microscopist that carefully removed the speck and mounted it on a glass microscope slide. When viewed with an optical microscope, the speck had the appearance of an aggregate of orange/brown particulates in a hard gray colored matrix as shown in Figure 3:

The cleanroom microscopist also noted that the dark speck responded to a magnet when it was passed under the glass slide, indicating that is likely a ferrous material. The speck was then transferred to a beryllium SEM stub for elemental composition analysis. The EDS data was obtained from one end of the speck that exhibited the highest concentration of the particulates. Figure 4 shows the SEM/EDS data:
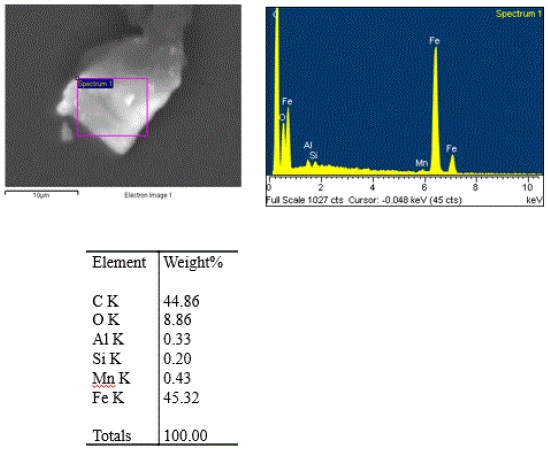
The iron to manganese ratio is consistent with carbon steel. The carbon content in carbon steel is in a concentration that is below the detection limit of EDS analysis. Therefore, the high carbon content of the particle is likely from the hard gray matrix. The orange/brown coloration of the aggregates suggests that they are carbon steel rust particulates.
2.3 Fractured steel filling tube
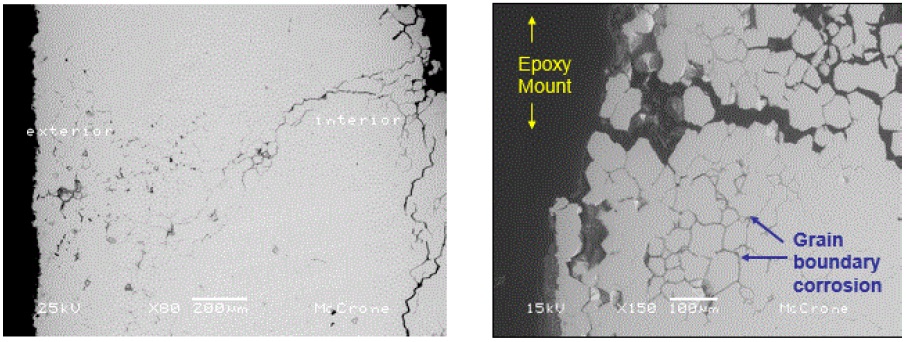
A steel filling tube fractured prematurely on a production piece of equipment. Analysis of fractures, known as fractography, starts with a visual examination of the fracture face followed by microscopic examinations. One piece of the fractured tube was cut out just below the fracture location so of the fracture face could be examined in the SEM. The fracture face exhibited severe intergranular corrosion throughout the thickness of the tube as shown in Figure 5:
Intergranular corrosion is a severe attack of the grain boundaries in metal resulting in a significant weakening of the metal strength. Because the grain boundaries are essentially dissolved away during the corrosion processes, the metal grains can easily fall away and become a contaminant in the food.
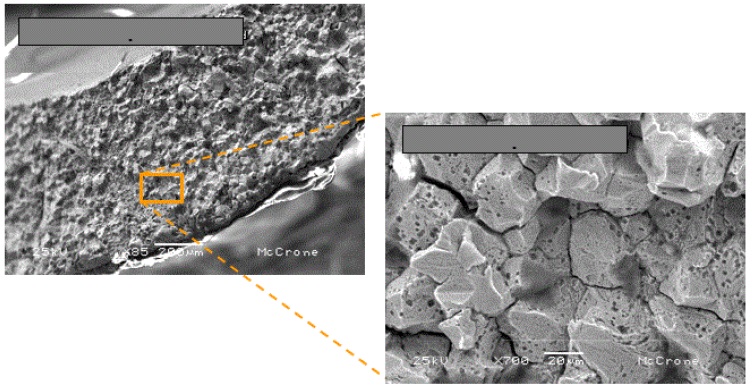
A portion of the tube at the fractured region was mounted in an epoxy medium in order to prepare a polished cross-section through the corrosion area (a common sample preparation method for metallographic analysis). The SEM examination clearly revealed the severity of the corrosion attack throughout the bulk of the metal as shown in Figure 6:
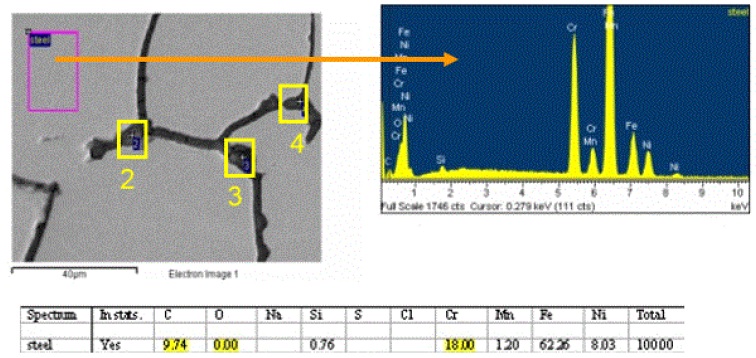
EDS analysis was conducted on the polished surface of the metal grains and also within the grain boundary regions. The metal grain analysis revealed that the steel is a 300 series stainless steel very similar to the 304 alloy as shown in Figure 7:
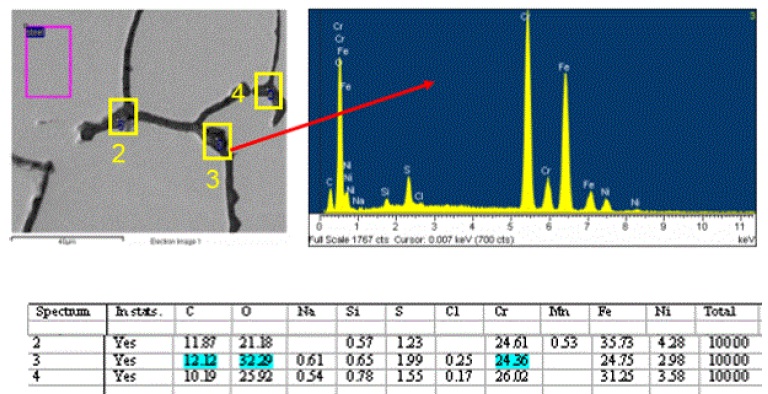
The grain boundary regions revealed interesting elemental composition data, which provided two important pieces of information. First, the presence of minor sulfur and trace chlorine indicated the main corrosive anions. Second, elevated levels of chromium and carbon compared to the polished grain surfaces indicated the presence of chromium carbides at the grain boundaries. Chromium carbides can act as catalysts for grain boundary corrosion attack and are minimized at the grain boundaries by heat treatment at the steel mills. Proper heat treating allows the carbides to migrate away from the grain boundaries into the bulk metal grains. Representative SEM/EDS data is presented in Figure 8:
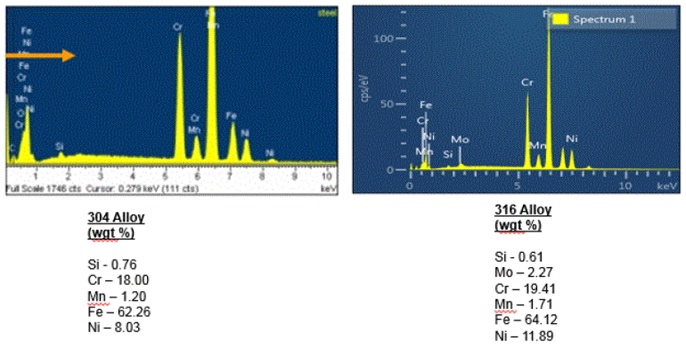
All of these results were discussed with the client, which resulted in additional interesting information. The steel tube was identified as a 304 alloy stainless steel; however, the specification for the tube called for a 316 alloy stainless steel. EDS analysis can easily differentiate the two different alloys as shown in Figure 9:
During routine maintenance in the production facility, an organic acid/strong oxidizing solution is used to clean the filling tubes and the cleaning crew had recently increased the concentration of the solution. Unfortunately, the organic acid is a known cause of intergranular corrosion on stainless steel alloys. Furthermore, the 304 alloy is, in general, much more susceptible to intergranular corrosion than the 316 alloy. In order to resolve the issue, the filling tubes needed to be replaced with the specified 316 stainless steel alloy tubes, heat treatment records were to be provided by the steel mill, and the cleaning solution either had to be used at the original concentration or replaced altogether with one that does not cause intergranular corrosion.
2.4 Orange/brown stains under food can internal coating
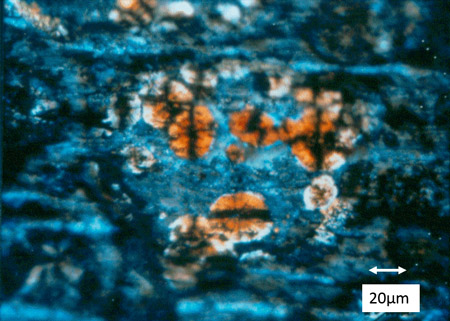
The tin plated steel food can was returned by a consumer complaining about orange/brown stains visible on the sidewall of the can. It was immediately recognized by the client that the stains were not normal and the client needed to know the identity and cause of the stains. Portions of the can sidewall were cut out for examination and analysis. The first phase of the analysis was to examine the stains with a polarized light microscope in reflected light mode utilizing crossed polarizing filters, which revealed the orange colored spherulite-like materials as shown in Figure 10:
SEM/EDS analysis of the spherulite-like materials qualitatively revealed high iron and oxygen content as shown in Figure 11:
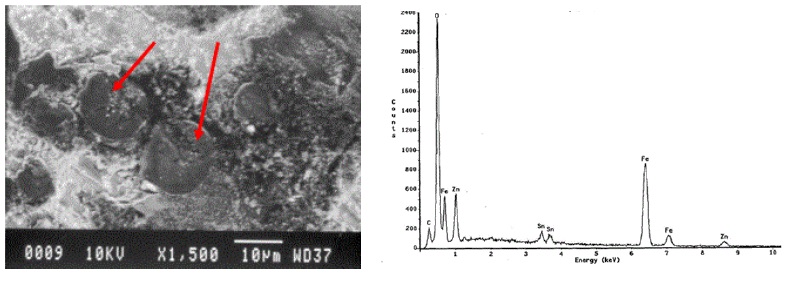
The SEM/EDS analysis suggested iron oxide, but because the can was tin plated steel, additional analysis was conducted on a few of the spherulite-like materials that were removed from the can wall by one of the cleanroom microscopists. The materials were mounted for analysis by powder X-ray diffraction (XRD), which revealed a major presence of iron carbonate. These analyses results indicated under film corrosion due to liquid migration through the internal coating from the product. With no other observations of coating defects, such as scratches, obvious porosity, craters, fisheyes, and loss of adhesion, one is left with the conclusion that the coating may have been under cured. Under cured coatings are very susceptible to liquid migration.
2.5 Multi-layer plastic pouch heat seal failure
Plastic pouches for food products typically are multilayer plastic materials where each layer provides specific chemical and physical properties to maintain product integrity. In this case the pouch, filled with a liquid product, started to leak. A stainless steel surgical razor blade was used to prepare cross-section cuts through and adjacent to the leak sites. The cross sections were mounted for examination in the SEM. Representative images are shown in Figure 12:
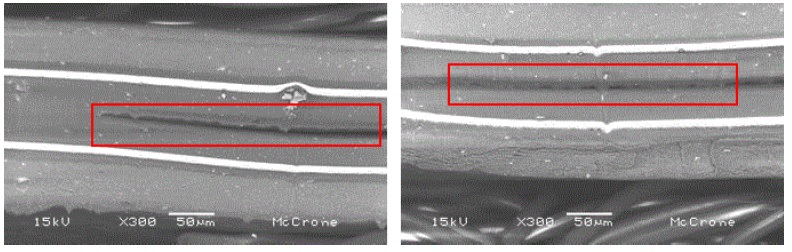
The regions shown within the rectangles reveal separation of the plastic layers near the center of the film, indicating that there was either insufficient heat or pressure to properly bond the layers. Under internal pressure from the liquid, the separated layers eventually caused a tear and subsequent leakage.
2.6 Metal wear particles from a powder seasoning
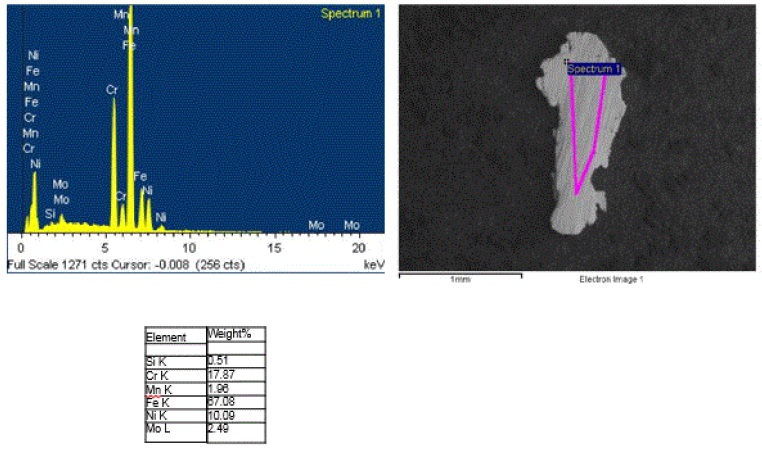
Metallic appearing particles were observed during standard production plant quality control inspection of the seasoning; a portion of which was submitted for analysis to identify the metal. Numerous metal particles, all 1 to 2 mm in size, were observed when the seasoning was spread out into a petri dish. The cleanroom microscopist isolated and mounted 19 of the particles for SEM/EDS analysis. All of the particles had an irregular shape and pressed appearance with parallel striations on the flatter surfaces, indicative of wear particles from scraping. The SEM/EDS analysis of the particles revealed all were consistent with a 316 alloy stainless steel as shown by the representative data in Figure 13:
2.7 SEM/EDS elemental mapping of a dry dog food pellet
EDS qualitative and quantitative analyses can provide the elemental compositional information, some of which can also be interpreted as more specific compounds in simple spectra. It is often useful to provide the elemental distribution within a complex matrix material in order to determine the association of various elements with each other. A dry dog food pellet clearly illustrates the power of the elemental mapping. Standard SEM/EDS analysis data for the pellet is provided in Figure 14:
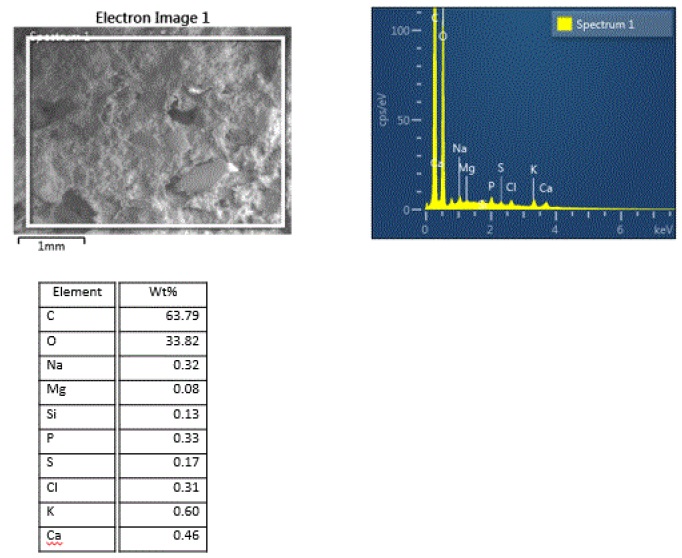
The high carbon and oxygen content indicate that the bulk of the material is carbonaceous/organic compounds, with the rest of the elements indicating multiple inorganic minor/trace components. The ingredients label on the dog food bag shows many other inorganic components that are apparently in too low of a concentration to detect some of the elements, such as, zinc, iron, aluminum. A portion of the elemental mapping is shown in Figure 15:
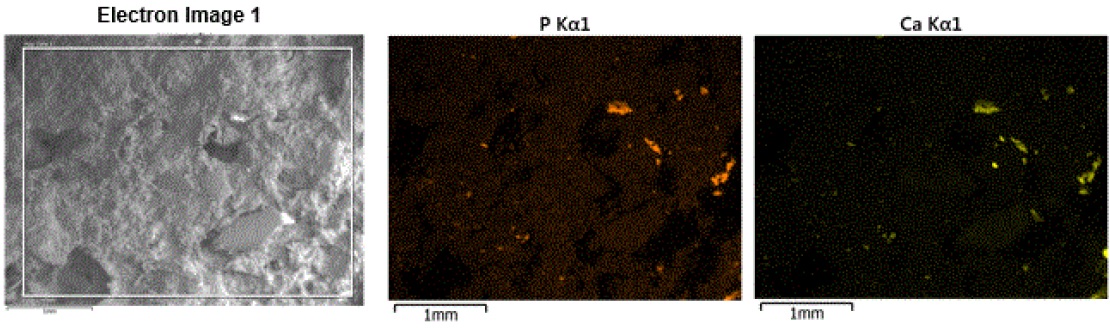
The phosphorus and calcium maps clearly show that the two elements are associated with one another and the particles have irregular shapes with a broad size range. Calcium phosphate compounds did not appear in the ingredients list; although there were other separate calcium-containing and phosphorus-containing ingredients. Calcium phosphate can also be indicative of bone and one of the main ingredients on the list was “fish meal”, which is produced by grinding cooked and dried fish. Therefore, the calcium phosphate is most likely fish bone fragments.
3. Conclusions
Through a series of case studies, SEM/EDS analysis has been shown to be a very powerful analytical tool for forensic analysis in the food industry. Microscopic sized foreign materials found as contaminants can often be identified by their elemental composition. As with most analytical chemistry analyses, sample preparation is a crucial step and any other observations made either through visual or optical microscopy examinations need to be noted and are often critical pieces of information to assist the SEM/EDS analyst.
Copyright Information:
COPYRIGHT 2015 Society of Photo-Optical Instrumentation Engineers (SPIE). One print or electronic copy may be made for personal use only. Systematic reproduction and distribution, duplication of any material in this paper for a fee or for commercial purposes, or modification of the content of the paper are prohibited.
Citation
Wayne D. Niemeyer, “SEM/EDS analysis for problem solving in the food industry “, Proc. SPIE 9636, Scanning Microscopies 2015, 96360G (October 21, 2015); doi:10.1117/12.2196962; http://dx.doi.org/10.1117/12.2196962
Comments
add comment