Stevia Sweeteners
Overview
Stevia sweeteners are a sugar substitute that is commonly branded as being all natural and containing no calories. These sweeteners are made using steviol glycoside which are extracted from stevia rebaudiana plants. The extract is created by drying the leaves of the stevia rebaudiana plant, and then steeping them in water. At the end of this process, the desired glycosides are recrystallized through evaporation. It is estimated that stevia extract is 150 times sweeter than sugar and for this reason it is used in small amounts, while the bulk ingredient is typically a natural sugar alcohol such as erythritol. For this project I examined different brands of stevia sweeteners, SPLENDA Naturals and Truvia. The characteristics for these brands were found to be the same. In 2008, the Food and Drug Administration classified stevia sweeteners as generally recognized as safe and useable as an ingredient in consumer products.
![]()
Water Soluble: Yes
HCl Effervescence: No
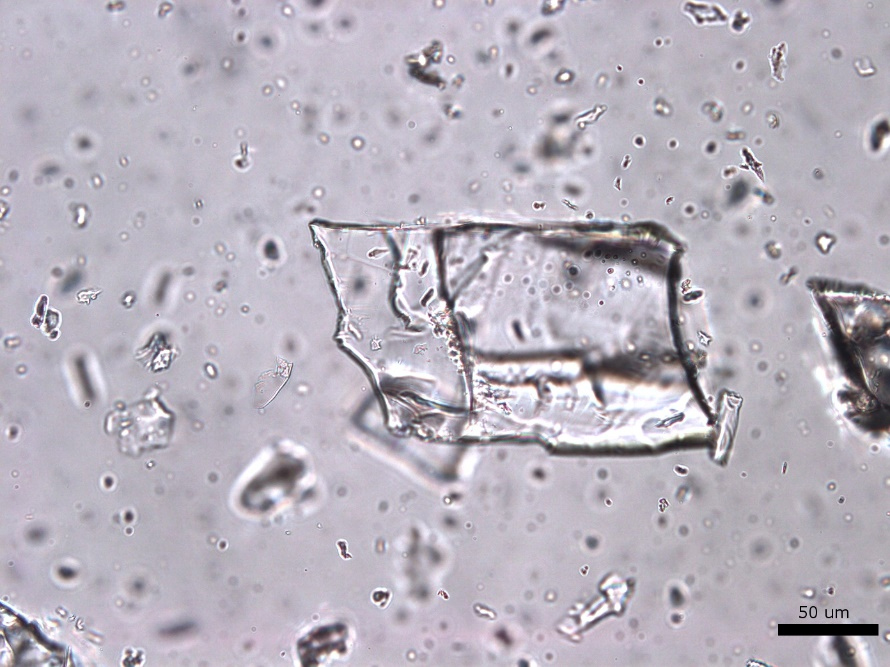
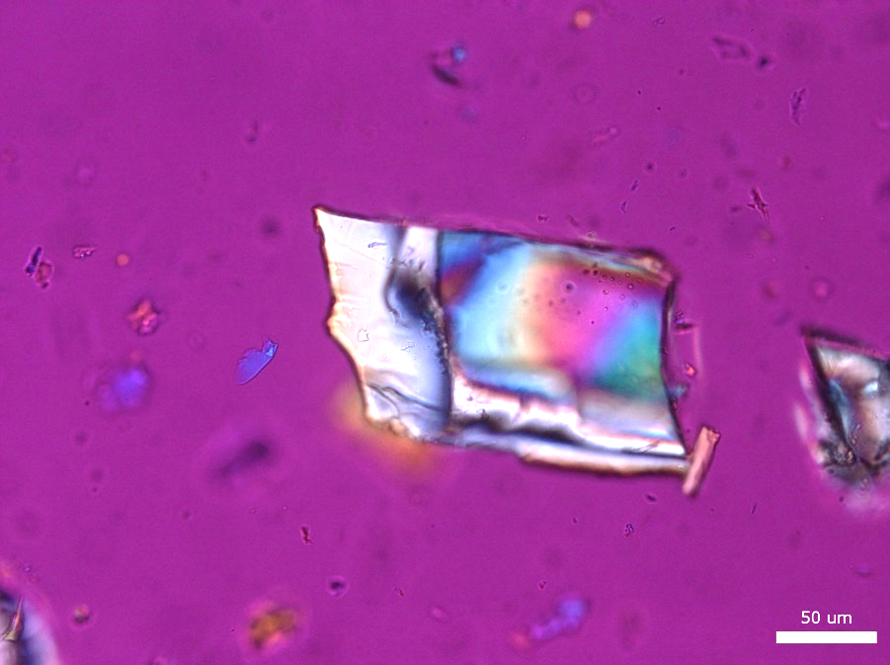
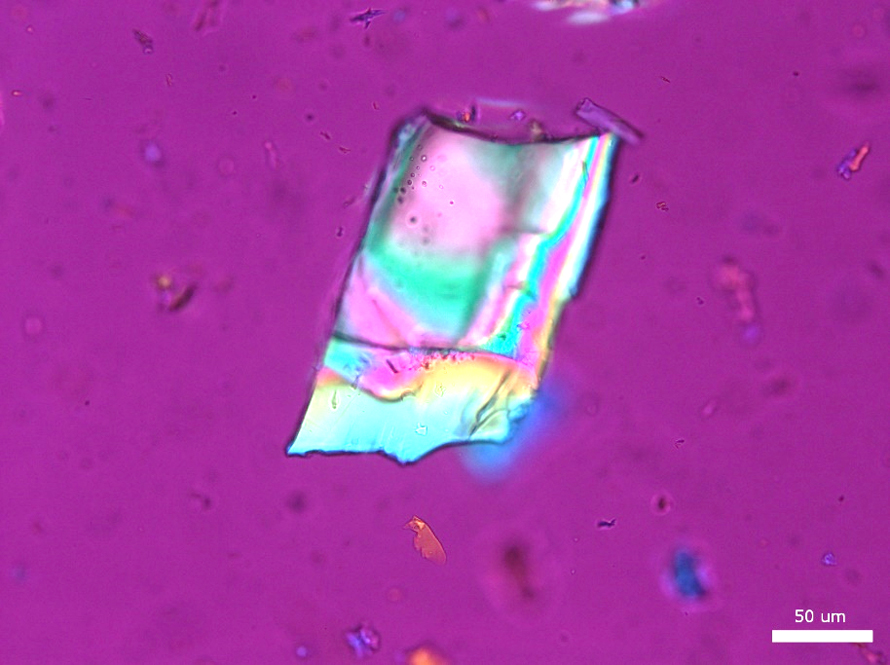
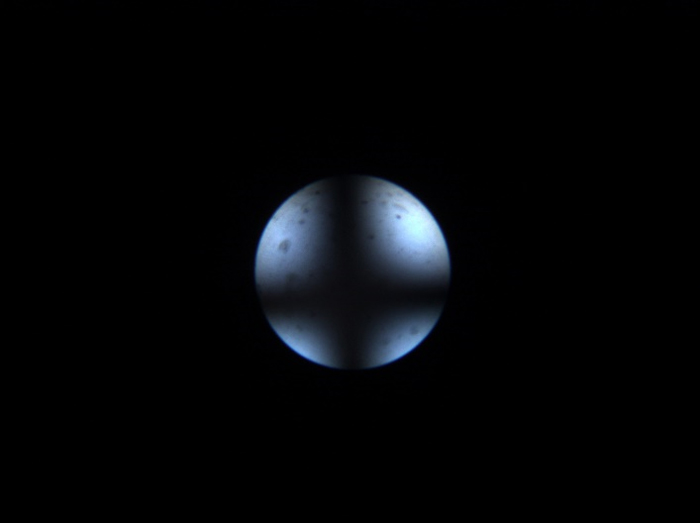
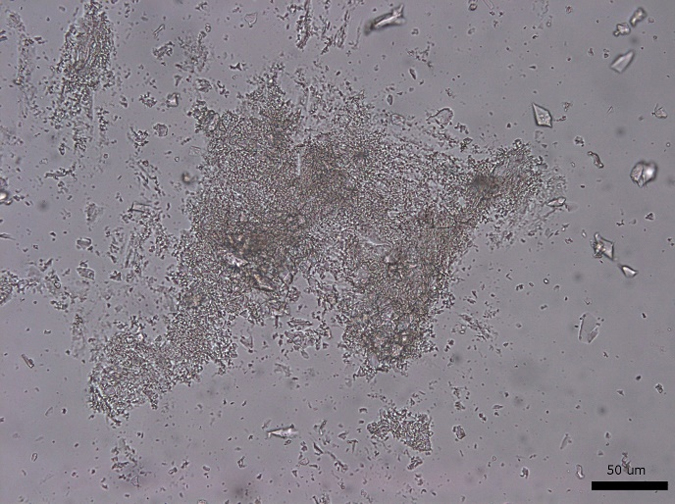
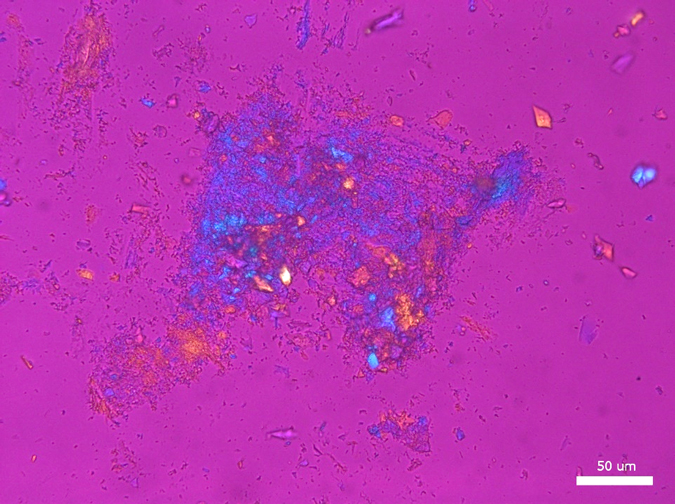
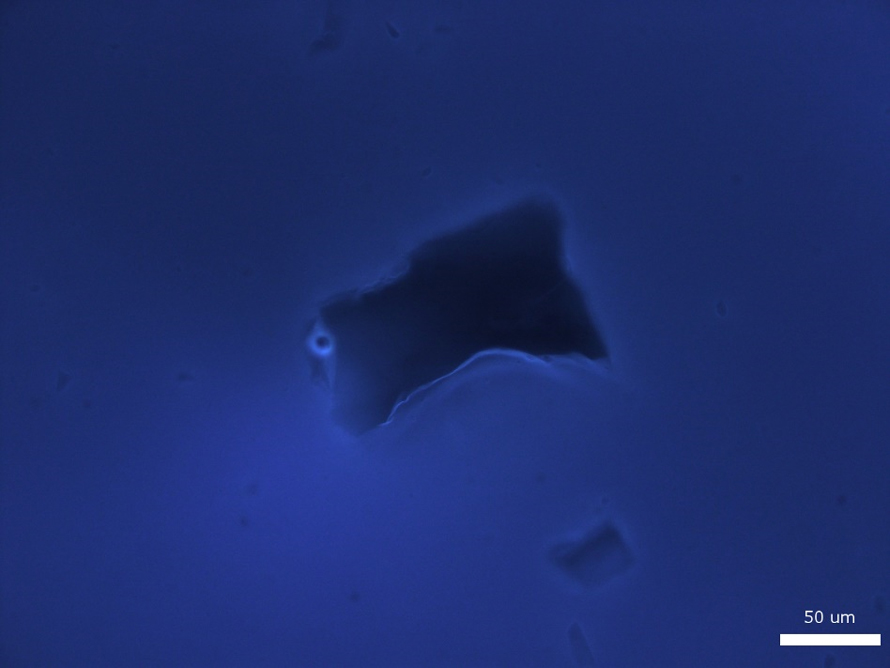
Large grains of stevia sweeteners were crushed into smaller pieces for viewing. The grains of crushed sweetener were mostly irregular but occasionally rectangular and flaky. The larger colorless particles occurred most frequently throughout the sample. These particles ranged in size from 30 µm to 300 µm and exhibit a refractive index that was less than 1.662. In crossed polarized light, these particles show low to moderately low birefringence. The particle also exhibited incomplete parallel extinction in crossed polarizers. When viewed with the Bertrand lens the particles appear to be uniaxial and have a negative optic sign. The finer grains were rarely seen in the distribution of particles. These particles are less than 2.5 µm in size and are irregular in shape. They commonly gathered in large clusters and had a refractive index that was less than 1.662. In crossed polars, the particles exhibit very low birefringence and undulose extinction. Because of their small size and shape, interference figure, optic sign and sign of elongation could not be determined.
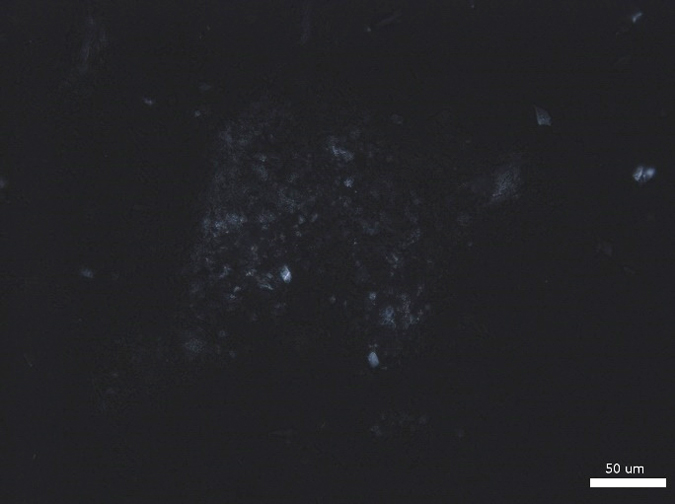
FLUORESCENCE MICROSCOPY
Sample did not fluoresce when viewed with narrow-band 365 nm ultraviolet light.
This sample is soluble in water and 1M HCl but did not effervesce; sample was insoluble in ethanol.
Click on any image to enlarge.

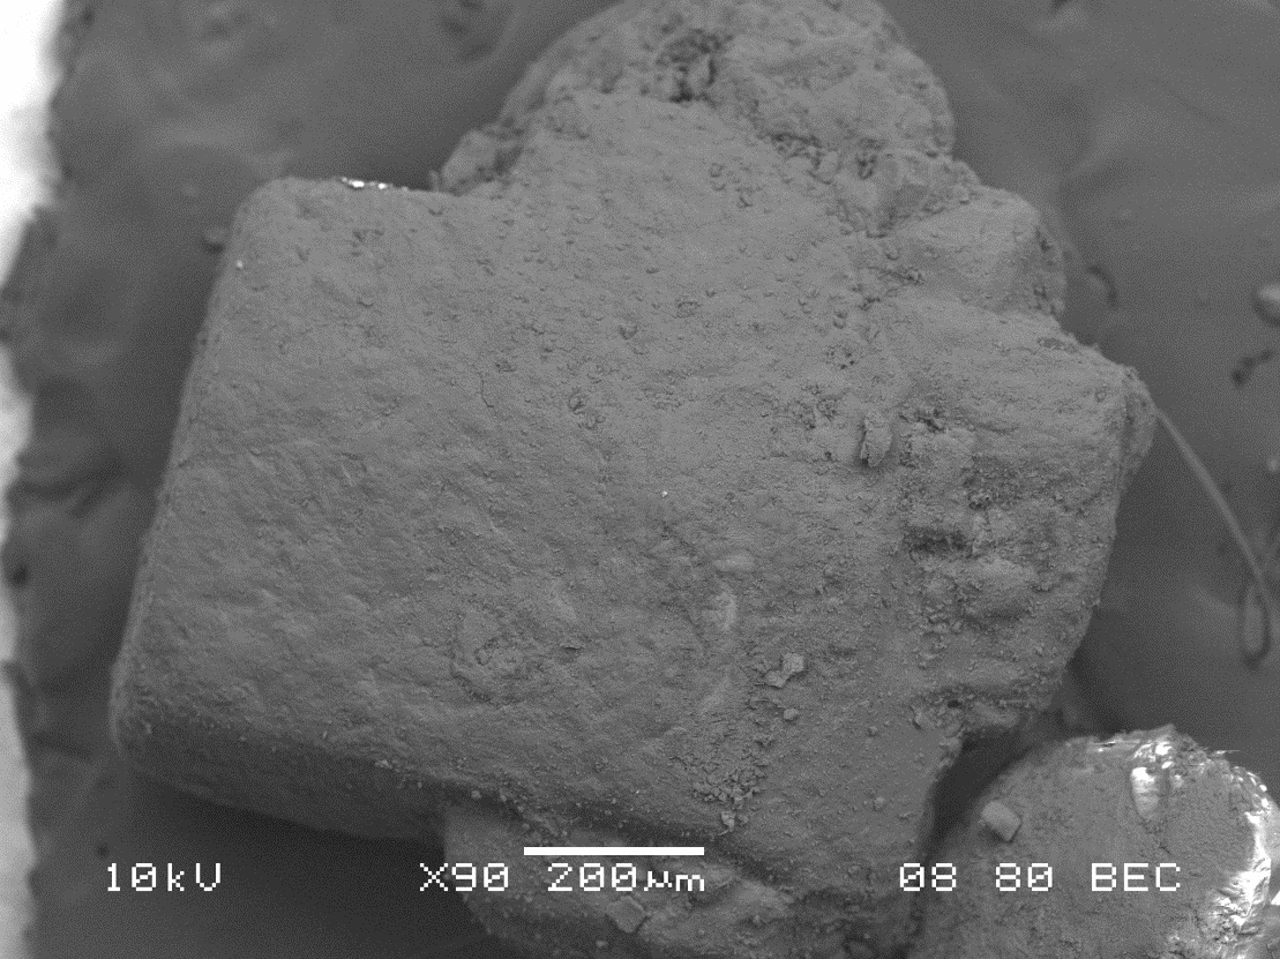
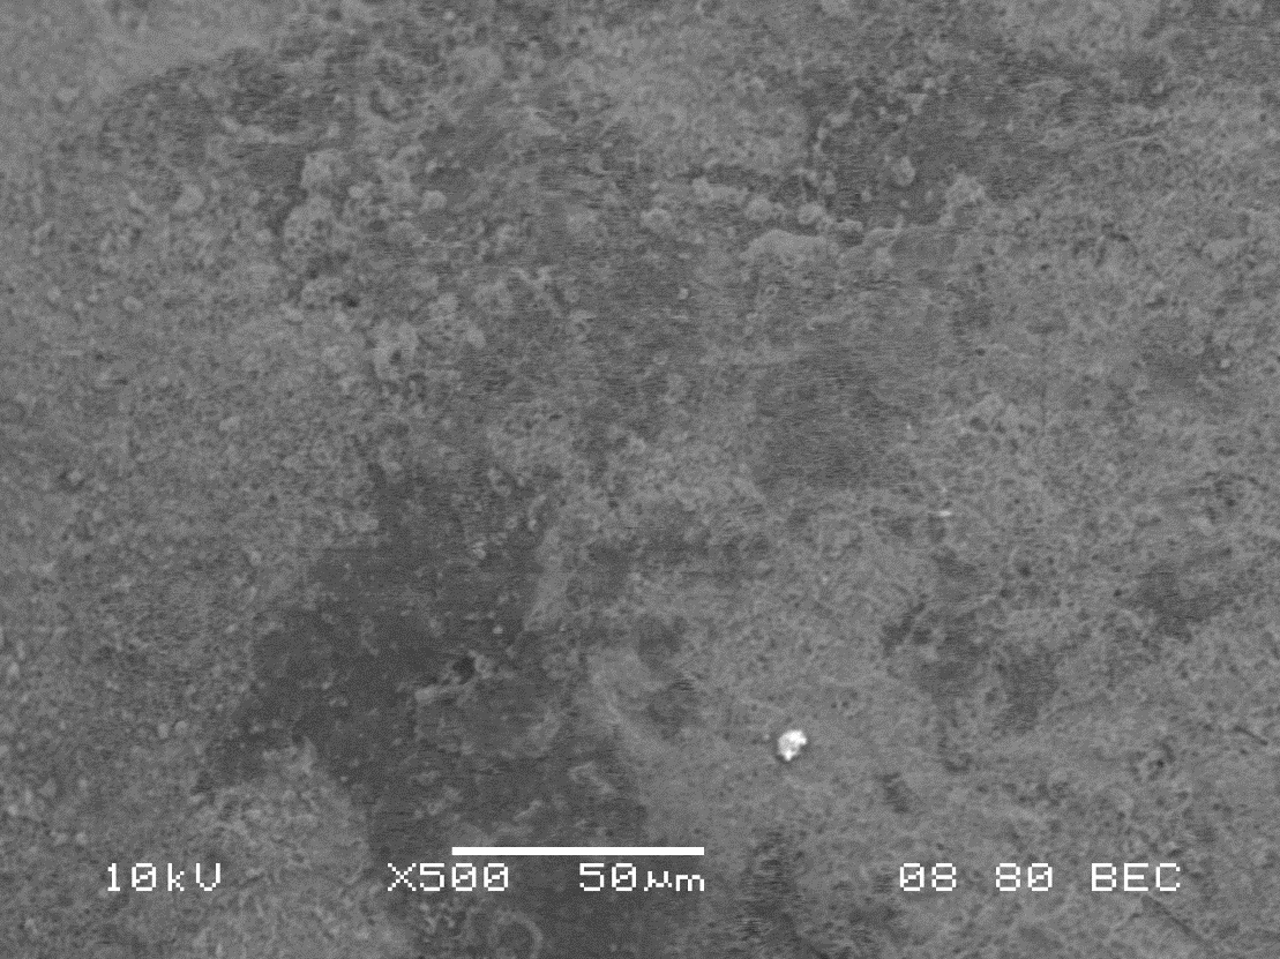
Scanning Electron Microscopy
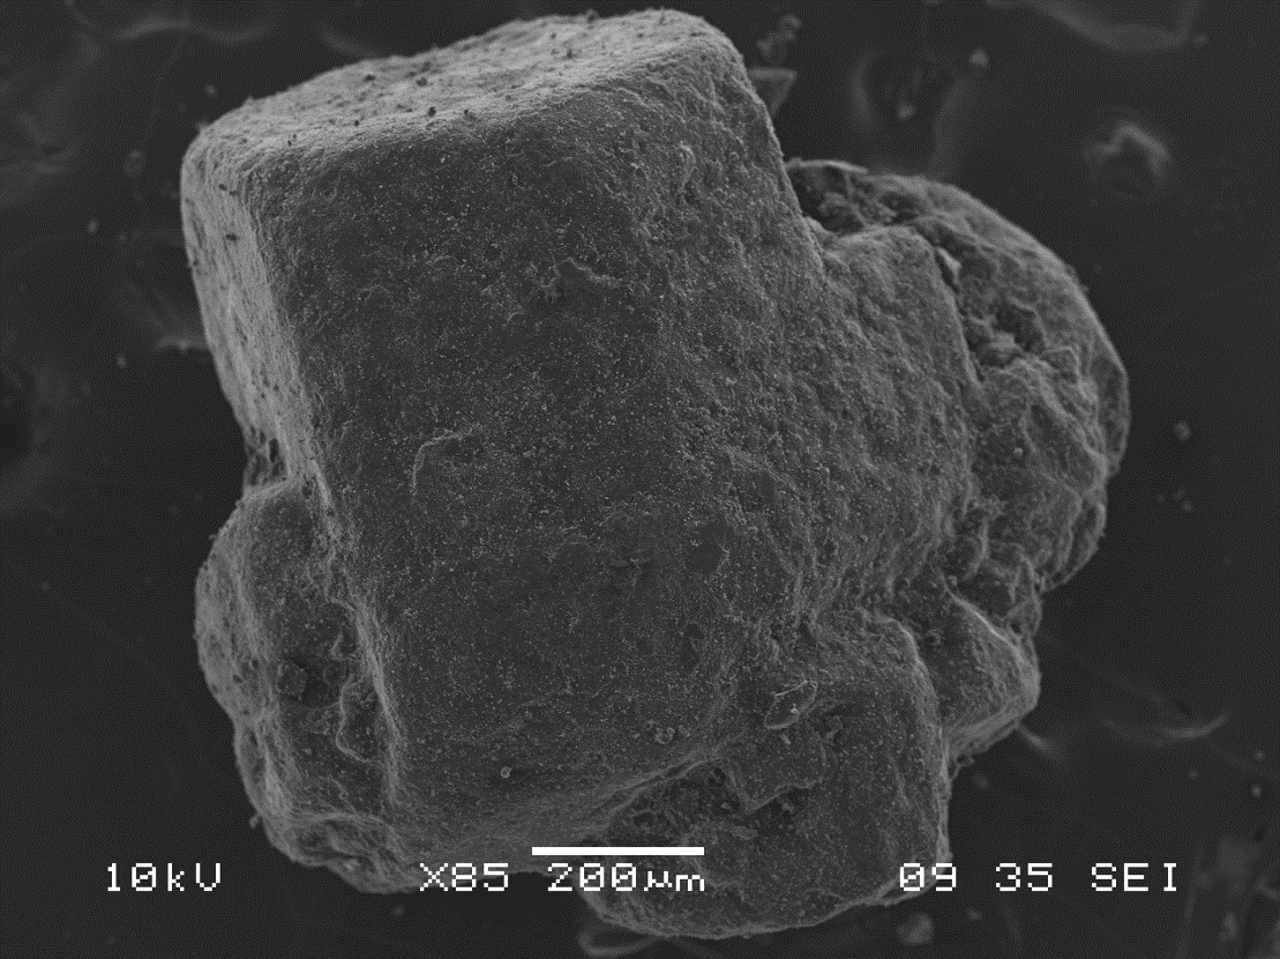
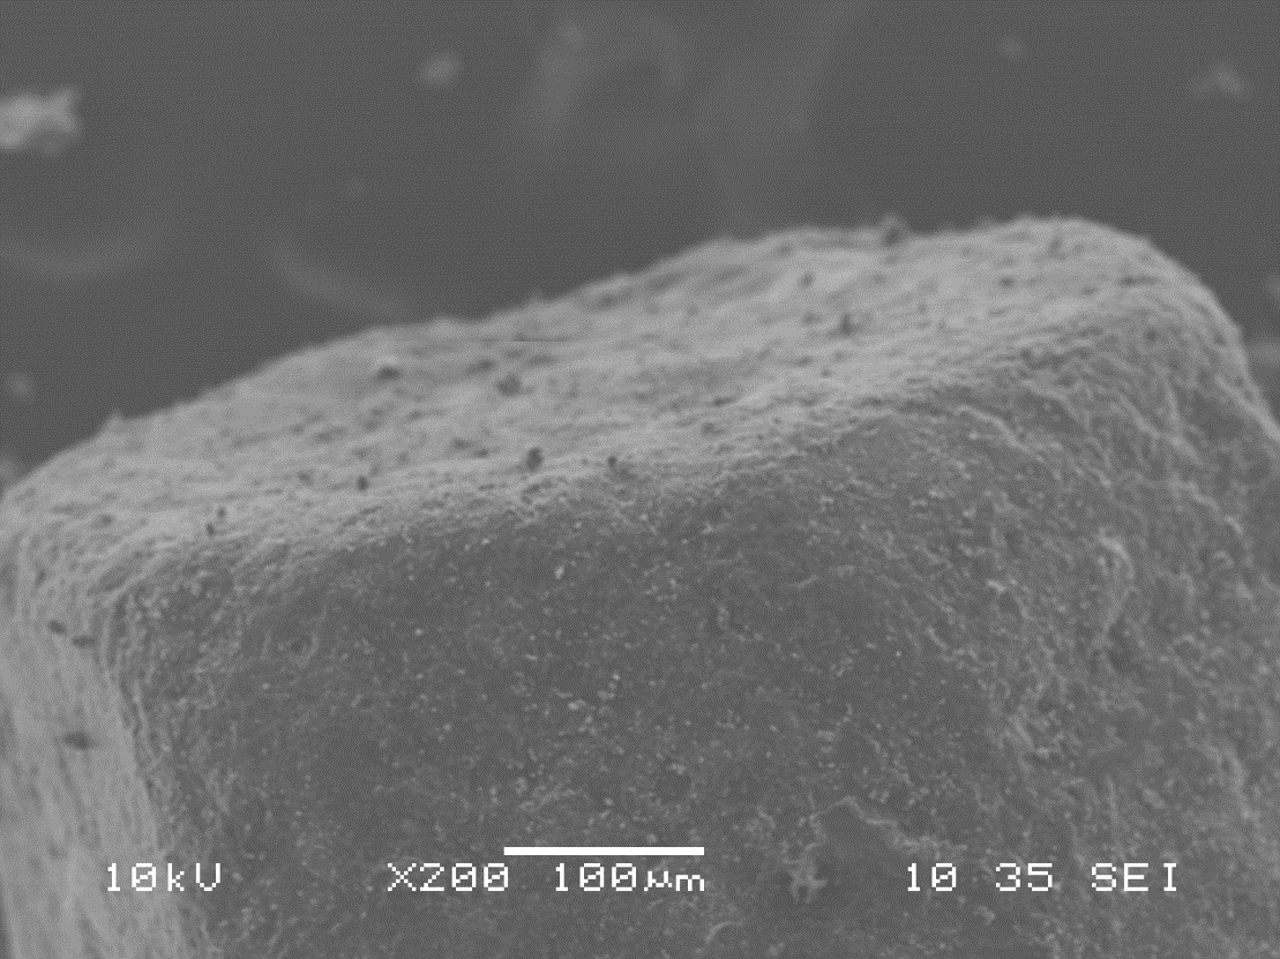
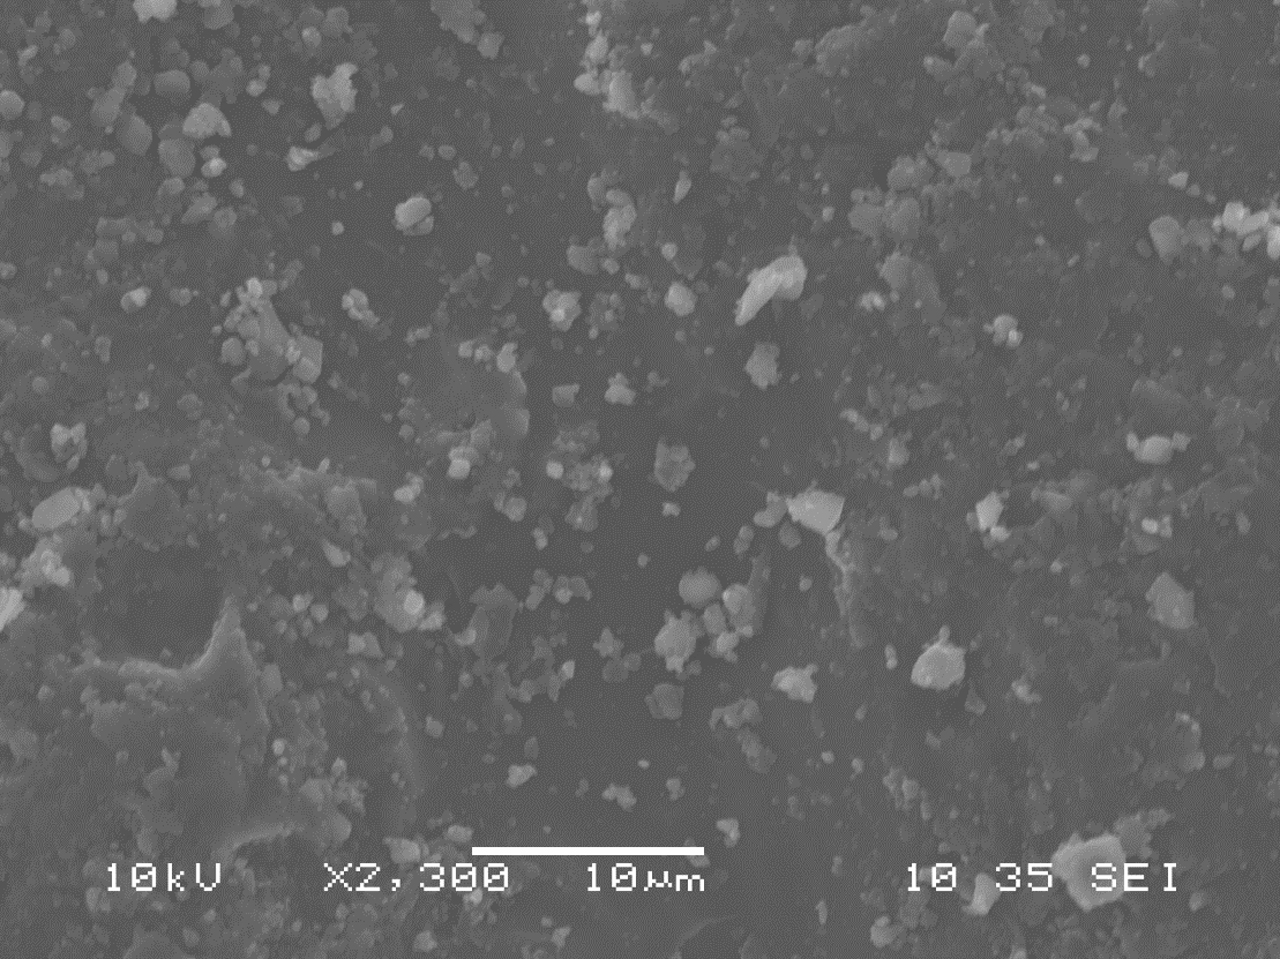
Images of stevia sweetener granules were taken in secondary electron detection mode. Samples were coated with carbon and images were taken with an accelerating voltage of 10 kV, a spot size of 35, and a working distance of 10 mm. Additionally, images were taken in backscatter electron detection composition mode with an accelerating voltage of 10 kV, a spot size of 80, and a working distance of 8 mm. These settings were used because they resulted in the best resolution with minimal amounts of charging or thermal damage. Uncoated samples of stevia sweetener experienced thermal damage quickly when exposed to the beam.
INSTRUMENTATION USED
- JEOL JSM-6480LV SEM
Energy Dispersive X-ray Spectrometry
Energy dispersive x-ray spectrometry was used to determine the elemental composition of stevia sweetener. Here, uncoated samples were used. Analyses on exterior surfaces of the stevia sweetener were performed using an accelerating voltage of 10 kV and a spot size of 65. The summary table of the elemental weight percentages can be found below. The spectrum indicates that the sample is composed of carbon and oxygen. Hydrogen does not appear of the spectrum because It has one valence electron and thus no characteristic X-Rays are generated when filling empty valence shells.
Conditions:
- EDS System Aztec Version 3.3
- EDS detector: Oxford X-max 50mm2 SDD
- Accelerating voltage 25 kV
- Analysis Range 0-10 kV
- Channels 2048
Elemental Weight Percentages

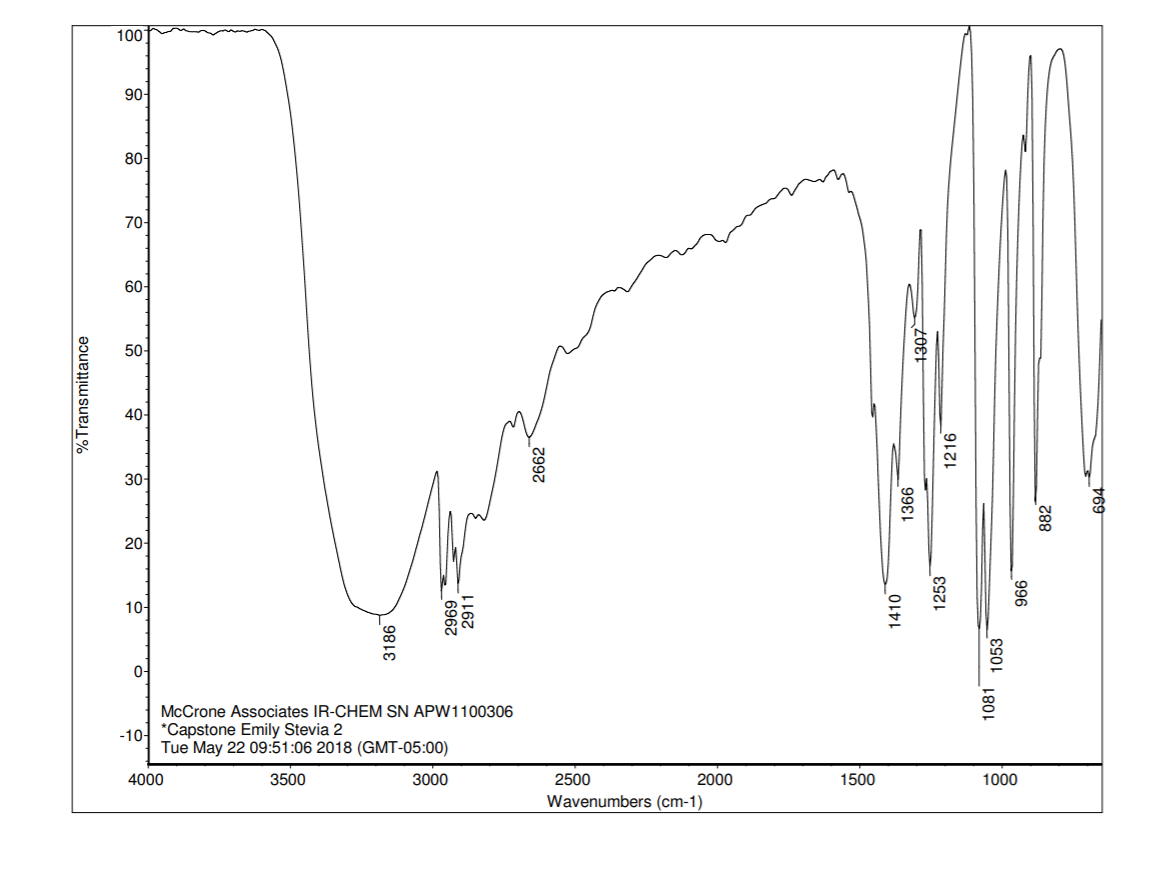
FTIR Characteristics
The resulting IR spectrum of stevia sweetener can be seen below. Key characteristics of this spectrum are the prominent O-H stretching peak at 3186 cm-1, C-H stretching peaks in the region between 2969 cm-1 and 2800 cm-1 and C-O bending peaks in the region between at 1081 cm-1 and 966 cm-1.
INSTRUMENTATION USED
Raman Characteristics
The Raman spectrum for stevia sweetener was collected using the 785 nm laser at 1% power.

INSTRUMENTATION USED
REFERENCES
Has Stevia Been Approved By FDA To Be Used As A Sweetener? Accessed 30 May 2018.
SPLENDA® Naturals Faqs. Accessed 30 May 2018.
Cardello, H.M.A.B. et al. ( 1999) Measurement of the relative sweetness of stevia extract, aspartame and cyclamate/saccharin blend as compared to sucrose at different concentrations. Plants for Human Nutrition Volume 54, Issue 2. pp. 119-129. Springer Nature, doi:10.1023/a:1008134420339. Accessed 30 May 2018.
Delly, John Gustav. (2017) Essentials of Polarized Light Microscopy and Ancillary Techniques. Hooke College of Applied
Sciences, Westmont, IL.
Comments
add comment