Topaz
Overview
Topaz, an aluminum silicate fluoride (and/or hydroxide), Al2SiO4(F,OH)2, is an orthorhombic crystal that occurs naturally in igneous rocks. The name is derived from the Greek topazios, which coincides with the early name of St. John’s Island in the Red Sea, where a yellow mineral was mined in ancient times. Topaz has been commonly used in jewelry for centuries. When found in nature, this crystal is often confused with less valuable citrine due to its naturally golden-brown to yellow color. Topaz is one of the hardest minerals, and is the hardest mineral in the silicate family.
The natural color of some topaz crystals can be altered to an orangey pink when heat treated. Some natural pink topaz crystals exist, however in these cases the pink coloring is a result of chromium replacing the aluminum atoms in its structure. Other color varieties of topaz occur, including blue, yellow, orange, and brown; all contain color centers—crystallographic defects in which anionic vacancy in a crystal is filled by one or more unpaired electrons. The more common blue color of gem topaz is primarily unnatural, and is produced by irradiating and then heating colorless crystals.
Polarized Light Microscopy
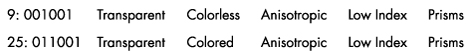
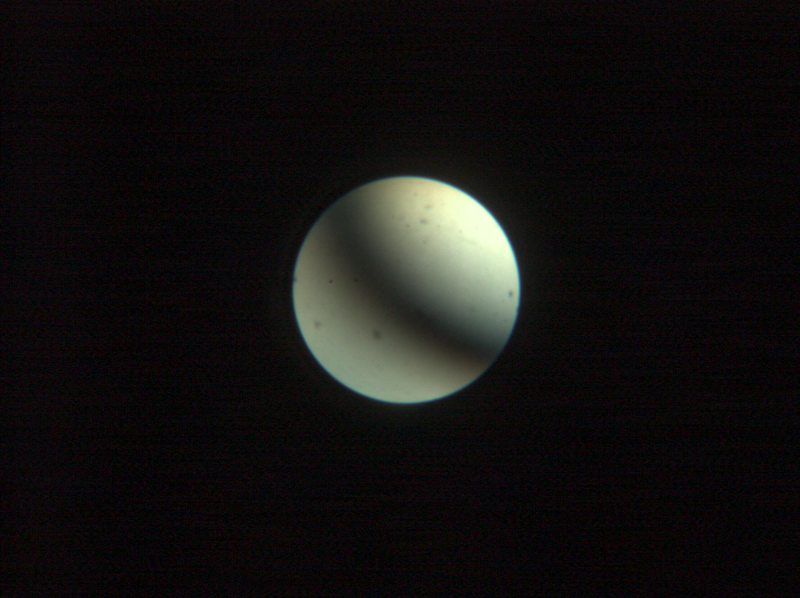
Crushed topaz consists of transparent, sharply angular flakes and chips (001000) devoid of color. The edges and faces are uneven due to conchoidal fracture. Topaz is orthorhombic and has indices of 1.606-1.629 (α), 1.609-1.631(β), 1.616-1.638 (γ); (+) 0.009-0.011. It resembles quartz, but has much lower contrast in Meltmount refractive index medium (1.6620). Topaz does not normally present pleochroism, but thick fragments may present shades of yellow to pink pleochroism. The specific gravity is 3.5, and the hardness is 8. Topaz has perfect single basal cleavage (001), and this tends to control orientation of crushed grain fragments.
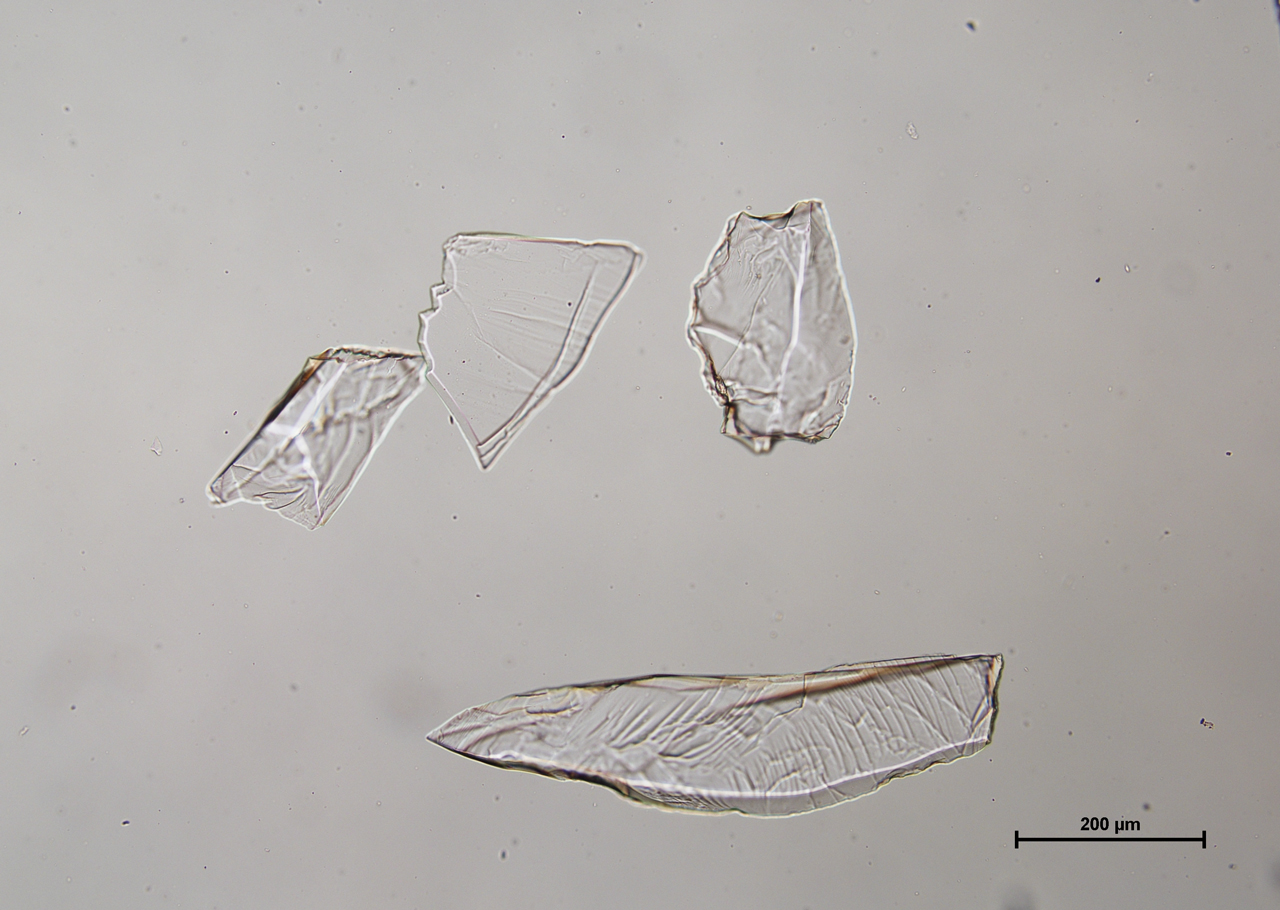
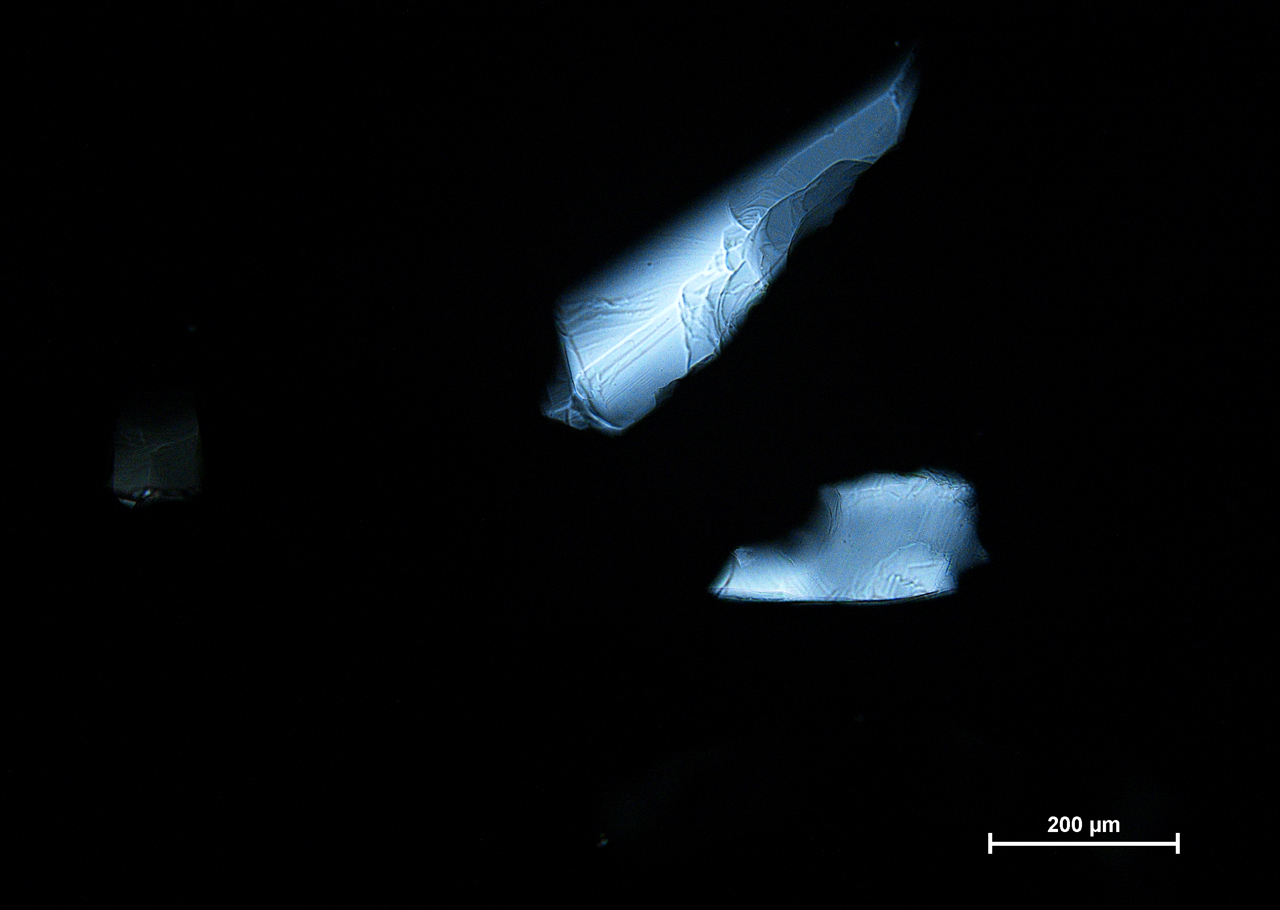
In crossed polarized light, topaz exhibits low to moderate retardation colors, with the possibility of higher order colors being visible in thicker grains. Upon rotating the stage, topaz shows complete extinction. Conoscopic analysis of topaz reveals a biaxial interference figure with a 2V angle from 45 – 60°. Topaz shows a positive optic sign when the red one compensator is introduced during conoscopic analysis.
Fluorescence Microscopy
When placed in narrow band UV light (360 – 370 nm), there is no observed fluorescence.
Click on any picture to view the full size image.


Tutorial: Selecting Biaxial Mineral Grains for Interference Figures and Refractive Index Measurement
Measuring nβ
For any biaxial mineral, nβ can be determined using optic axis and pendulum figures (off center optic axis).
Additionally, Bxa/Bxo figures can be used, but more patience and skill are required to find well-centered figures.
- Optic axis figure: Between crossed polarizers, locate a grain that remains gray upon stage rotation. An interference figure of this orientation will yield one isogyre. With the concave face of the isogyre facing the NE quadrant, β vibrates in a direction perpendicular to the optic plane (from the NW-SE quadrants). Rotate the stage clockwise such that β is oriented E-W (or parallel to the lower polarizer). Return to orthoscopic illumination and measure nβ. If one should find a centered optic axis figure, nβ can be measured in any position of stage rotation.
- Bxa figure: Follow the same procedure as stated for the optic axis figure. Depending on the 2V, this Bxa interference figure will yield one or two isogyres within the field of view. Orient the concave faces of the isogyres such that they face the NE-SW quadrants; β vibrates between the two isogyres from the NW-SE quadrants. Rotate the stage such that β is oriented E-W (or parallel to the lower polarizer). Return to orthoscopic illumination and measure nβ.
- Pendulum figure: Between crossed polarizers, a grain with an off-center optic axis will show low order retardation colors when the stage is rotated. An interference figure in this orientation will produce a pendulum-like figure. By orienting the pendulum N-S, nβ vibrates E-W, the refractive index can be measured in plane polarized light. Return to plane polarized light and measure nβ.
Measuring nα and nλ
nα and nλ of a grain can be measured using an optic normal (flash figure). Additionally, these refractive indices can be measured from a Bxa figure; however, the optic normal (flash figure) method is most commonly used throughout this procedure. Determining the optic sign is necessary before measuring both refractive indices.
- Optic normal (flash figure): Between crossed polarizers, locate a grain that shows the highest retardation colors and quickly goes extinct. An interference figure in this orientation shows broad, fuzzy isogyres. With the broad isogyres covering most of the field of view, rotate the stage clockwise until the isogyres exit the field of view in the NE-SW quadrants; isogyres of a biaxial mineral exit toward the Bxa. For an optically positive mineral, Bxa equals Z; orienting Z (γ-ray vibrational direction) N-S places X (α-ray vibration direction) E-W (parallel to the lower polarizer). Return to orthoscopic illumination to measure nα. Rotate the stage 90° to measure nλ of the same particle. NOTE – This process is opposite for an optically negative mineral (Bxa = x).
PLM REFERENCES
Nesse, W. D. (2004). Introduction to optical mineralogy (3rd ed.). Oxford University Press, NY.
Karen Hurrell; Mary L. Johnson (2016). Gemstones: A Complete Color Reference for Precious and Semiprecious Stones of the World. Book Sales. p. 169. Full text available online.
SEM Characterization
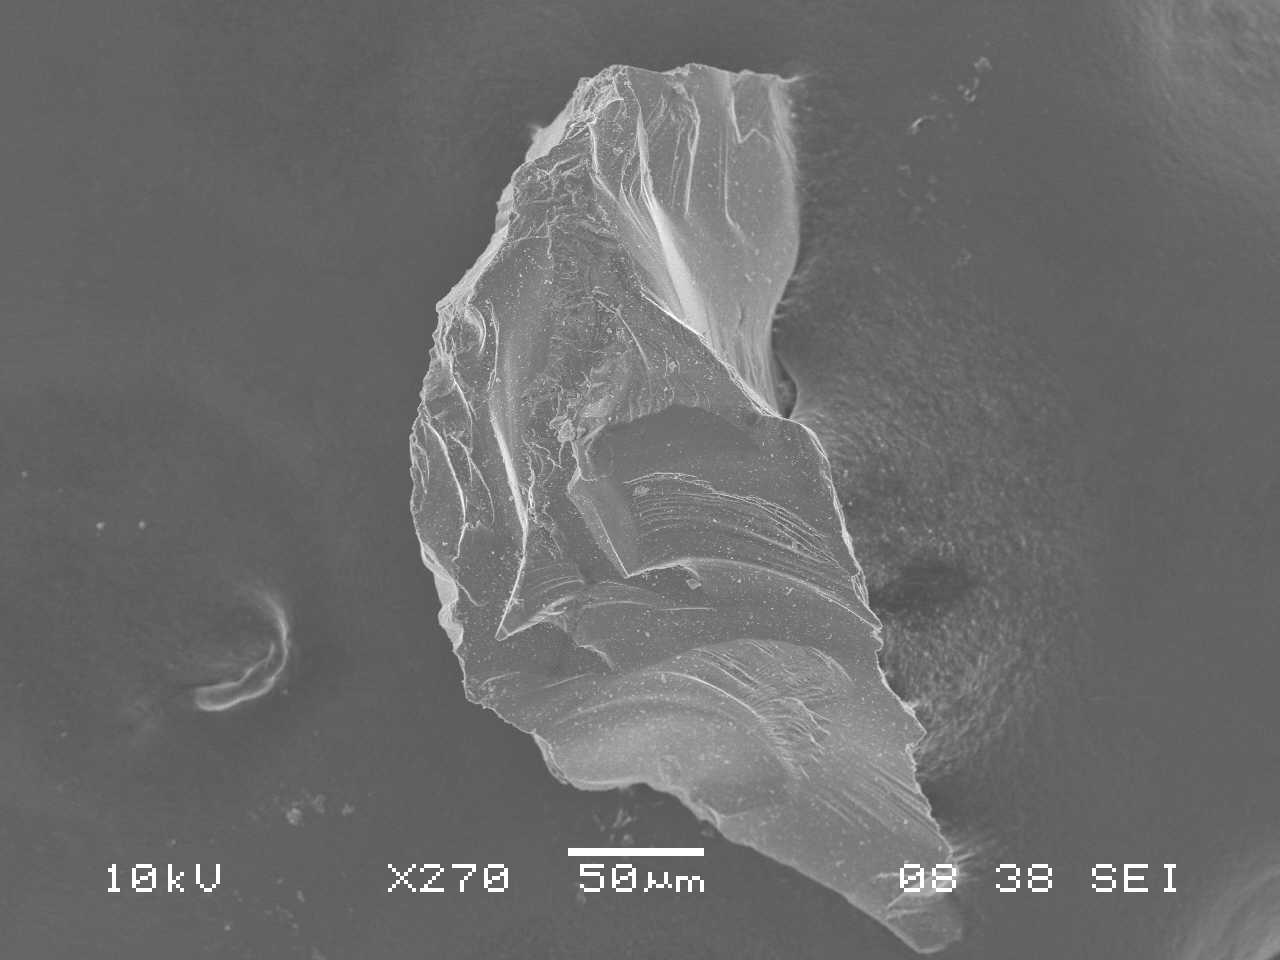
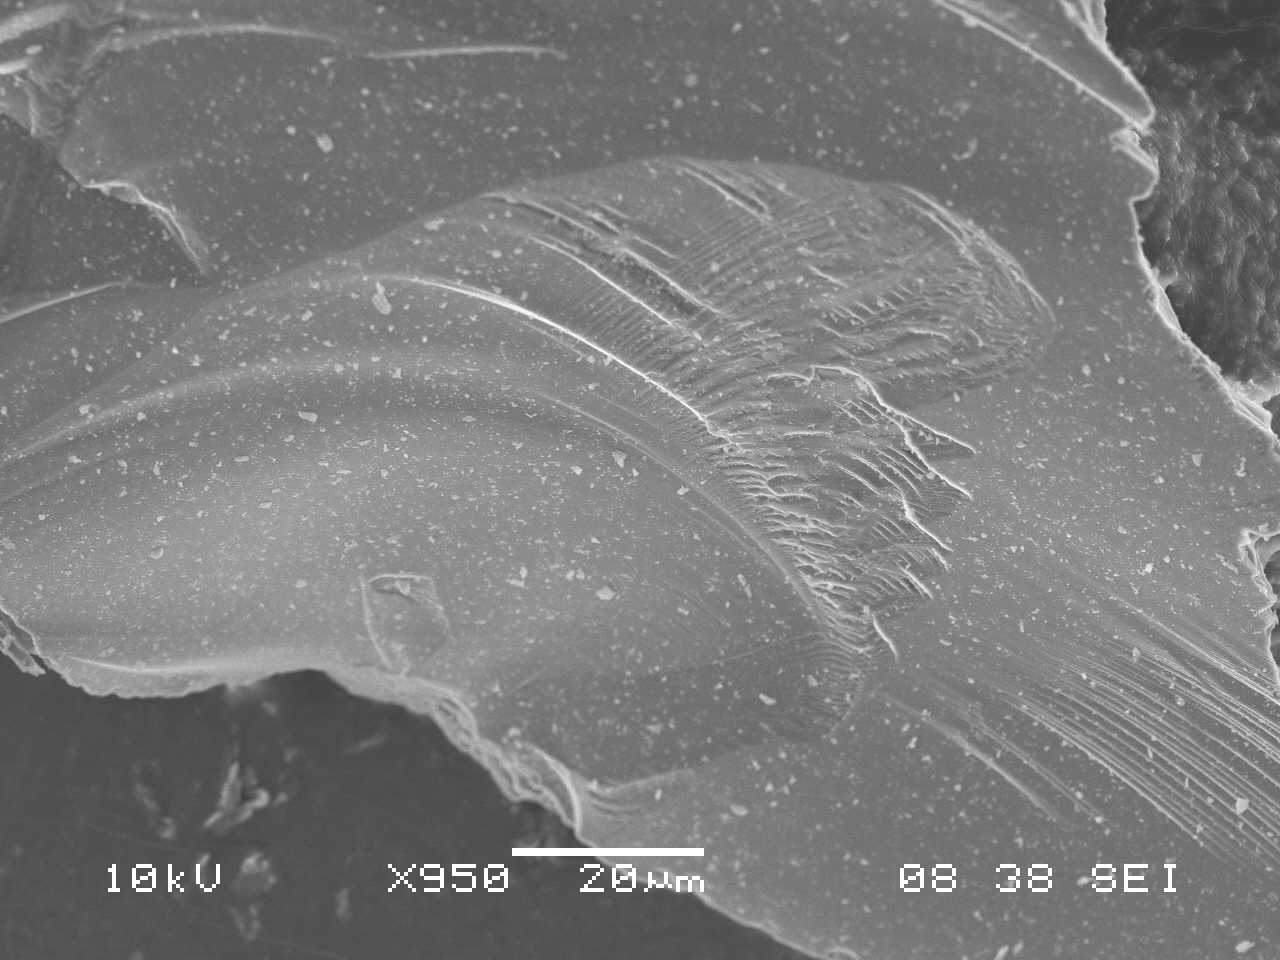
Due to the nonconductive nature of topaz, Al2SiO4(F,OH)2, a 2.0 nm gold-palladium coating was applied to the grains to provide a conductive coating. Without the use of a gold-palladium coating, analysis of topaz would be limited to low vacuum conditions in order to reduce charging.
SEM images highlight the characteristic conchoidal fractures found on comminuted topaz grains (S-101, 102). S-101 displays the irregular shape that crushed topaz grains usually form, with very few straight edges. Topaz has perfect basal cleavage and this tends to control orientation of crushed grain fragments, though this is not demonstrated in the images.
Click on any picture to view the full size image.
INSTRUMENTATION USED
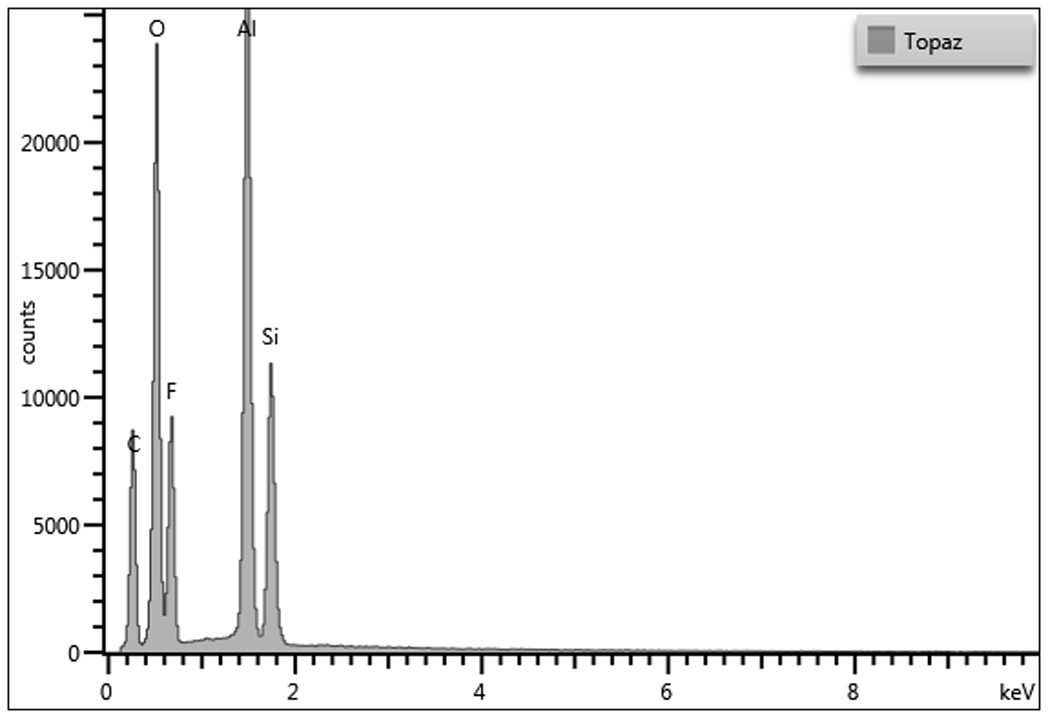
Energy Dispersive X-Ray Spectrometry (EDS)
Energy dispersive X-ray spectrometry was used to determine the elemental composition of topaz. Due to the homogeneity of the sample, variation between areas yield similar elemental results. The summary table of the elemental weight percentages can be found below. The presence of gold in each spectrum is due to the ~2.0 nm gold-palladium coating applied to the sample, but a deconvolution function was applied to the quantitative data to remove gold and accurately report the weight percentages of the sample. The major carbon component may be due to the carbon tab on which the topaz was mounted.
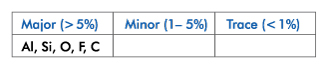
Trace elements may vary depending on impurities in source material.
Click on the image to view an enlargement.
INSTRUMENTATION USED
- JEOL JSM-6480LV with Oxford EDS
EDS System: Oxford AZTEC v. 3.3
Accelerating Voltage: 15kV
Analysis Range: 1-10kV
Fourier Transform Infrared Spectroscopy
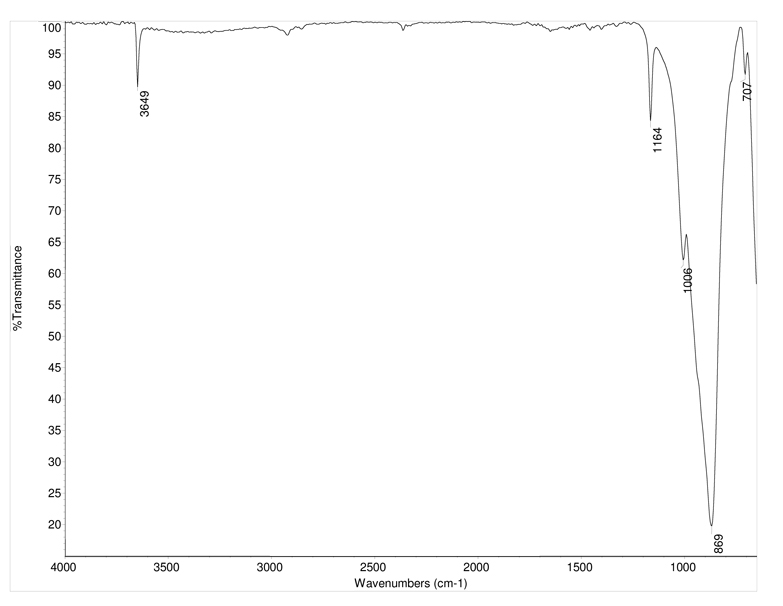
Topaz shows very strong, sharp peaks in its FTIR transmission spectrum. The most recognizable peaks include the strong peak at ~870 cm-1, which corresponds to a shifted Si-O-H bonding peak. Additionally, the fluorine presence is indicated by the sharp C-F bonding peaks at 1164 and 1006 cm-1. The peak at 3650 cm-1 is related to the structurally hindered O-H stretch.
INSTRUMENTATION USED
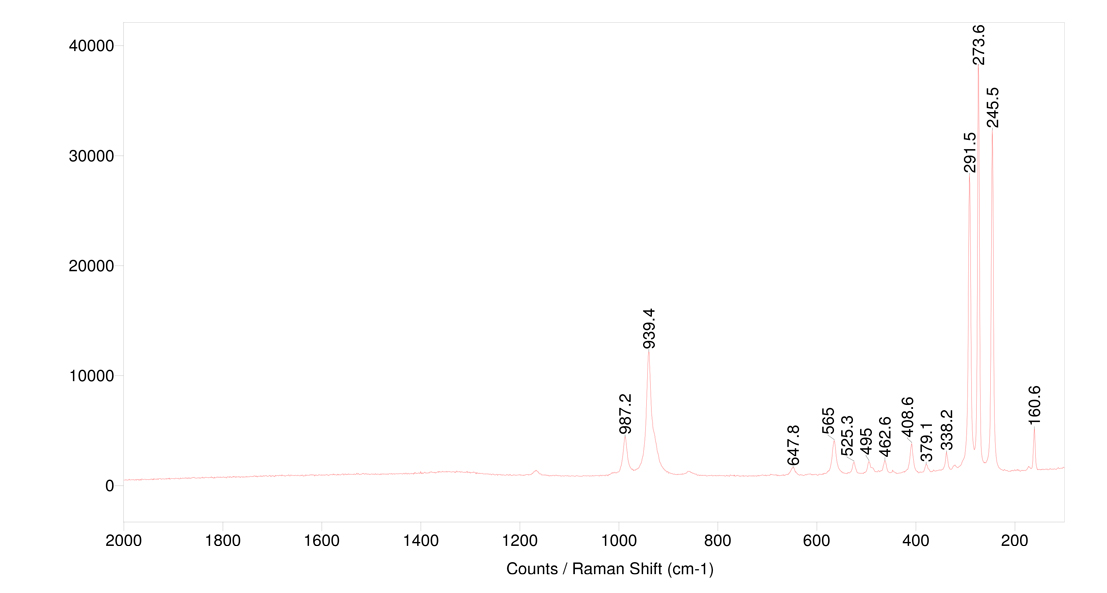
Raman Spectroscopy
Topaz is a relatively good Raman scatterer, showing sharp bands across the spectrum. The peaks around 1000 cm-1 correspond to Si-O-H stretching. Peaks below 500 cm-1 are attributed to the crystal lattice structure.
Comments
Tom Kremer
A well written description!
I have two questions. Where does the carbon come from in the EDS spectrum when the topaz is a silicate mineral? Second, in the same way, how can there be a C-F bond at 1164/cm and 1006/cm, again, when topaz does not contain carbon?
Replies
Leslie Bolin
Thank you for the compliment, Tom. The author, Otyllia, carbon coated the sample to prevent charging during analysis. Carbon is also deposited on the sample during analysis as the electron beam cracks residual hydrocarbons in the sample chamber as thus deposits carbon on the sample. Carbon should have been removed from the analytical result. She most likely used the same coated sample in the FTIR. Thank you for bringing this oversight to our attention; we are working on corrections.
add comment