Ultramarine Blue Pigment, Synthetic
Overview
Ultramarine is also known as French ultramarine, and permanent blue. Currently, all of the commercially used ultramarine is made artificially by a furnace process. Synthetic ultramarine is identical in elemental composition and structure to the naturally produced ultramarine (see lapis lazuli or ultramarine, natural). There are two distinct kinds of ultramarine produced, soda ultramarine and sulfate ultramarine. The soda ultramarine is produced by heating, in a closed fire clay crucible in a muffle furnace, a finely ground mixture of china clay, soda ash, coal, silica, and sulfur. The heat is maintained in the muffle furnace for 12 to 18 hours, the product is cooled, ground, and lixiviated (to extract soluble constituent from [a solid mixture] by washing or using percolation) to remove the salts, dried, and ground again. The sulfate ultramarine is produced using sodium sulfate in place of the soda ash; this changes the color and adds a greenish tinge. Variations of the above processes can lead to blue, red, and violet ultramarines in various shades and hues. The date when synthetic ultramarine started to be used instead of natural ultramarine is unknown, but it is thought to be around 1830, or soon after. In color, quality, and appearance, synthetic ultramarine is far superior to Prussian blue and indigo.
Polarized Light Microscopy

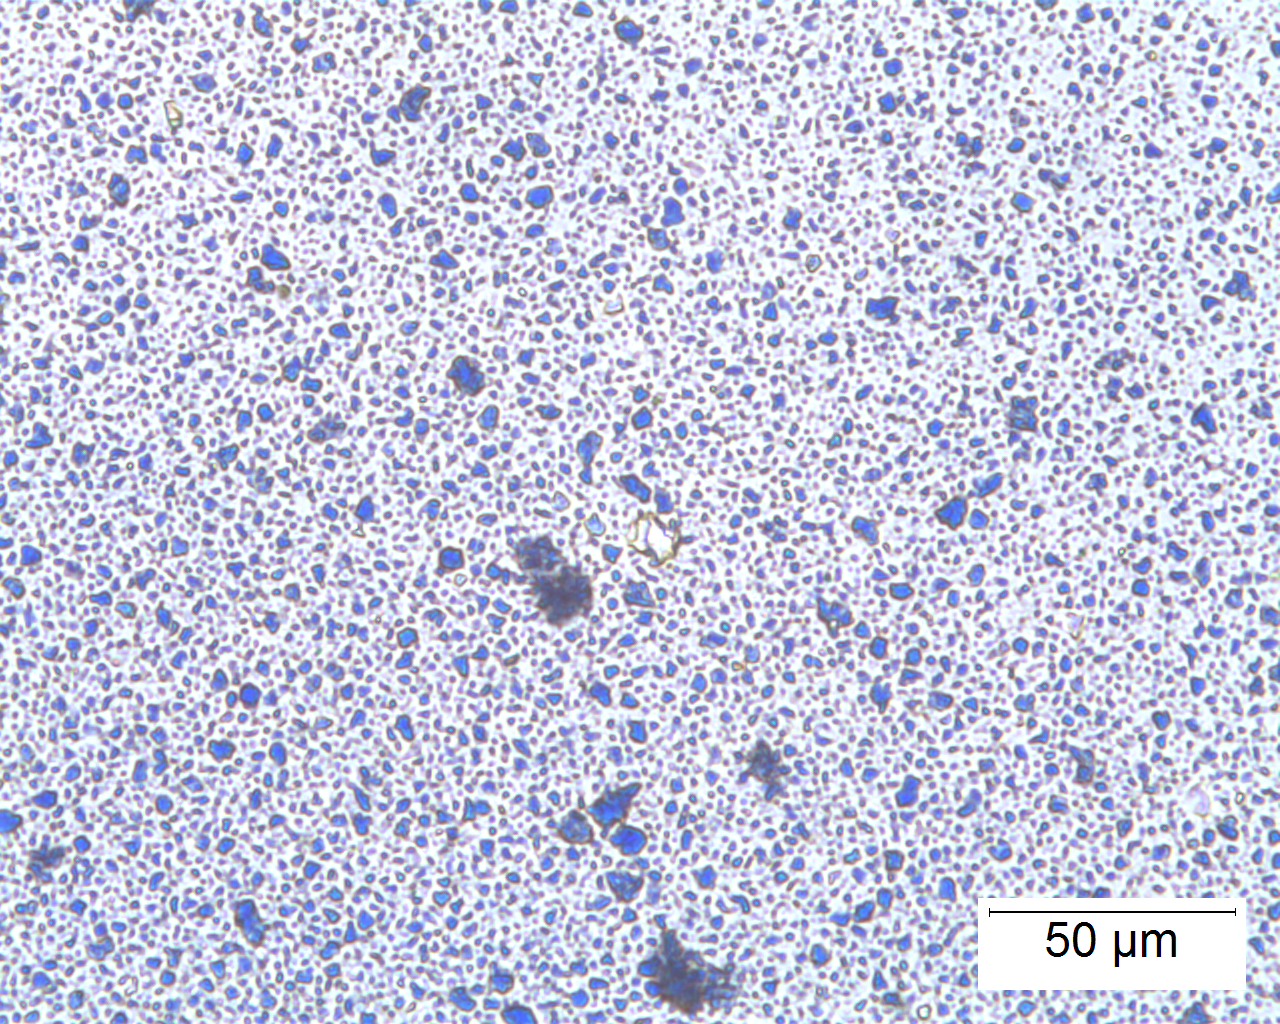
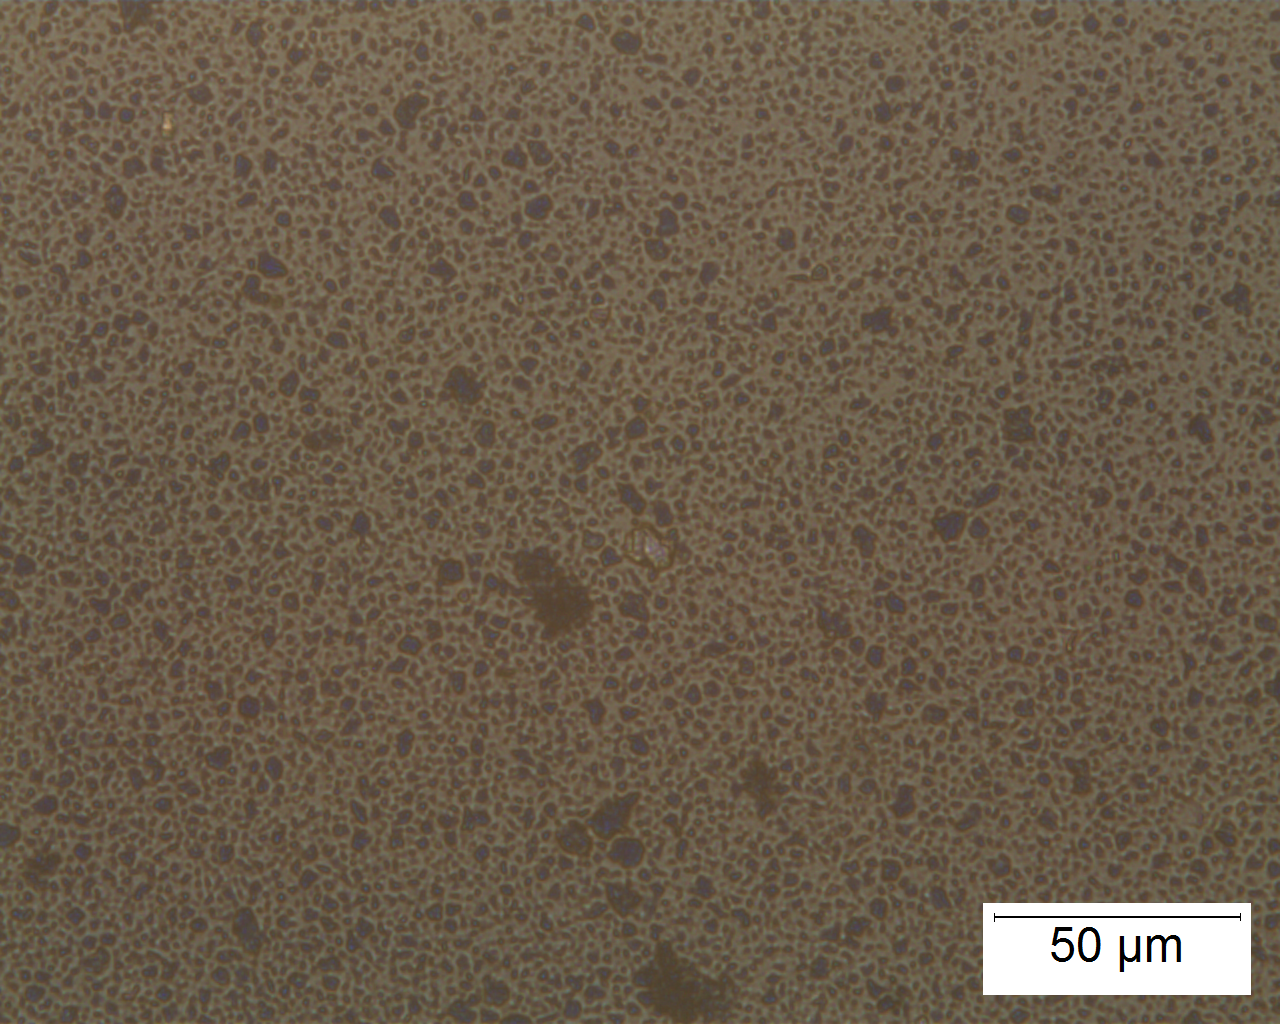
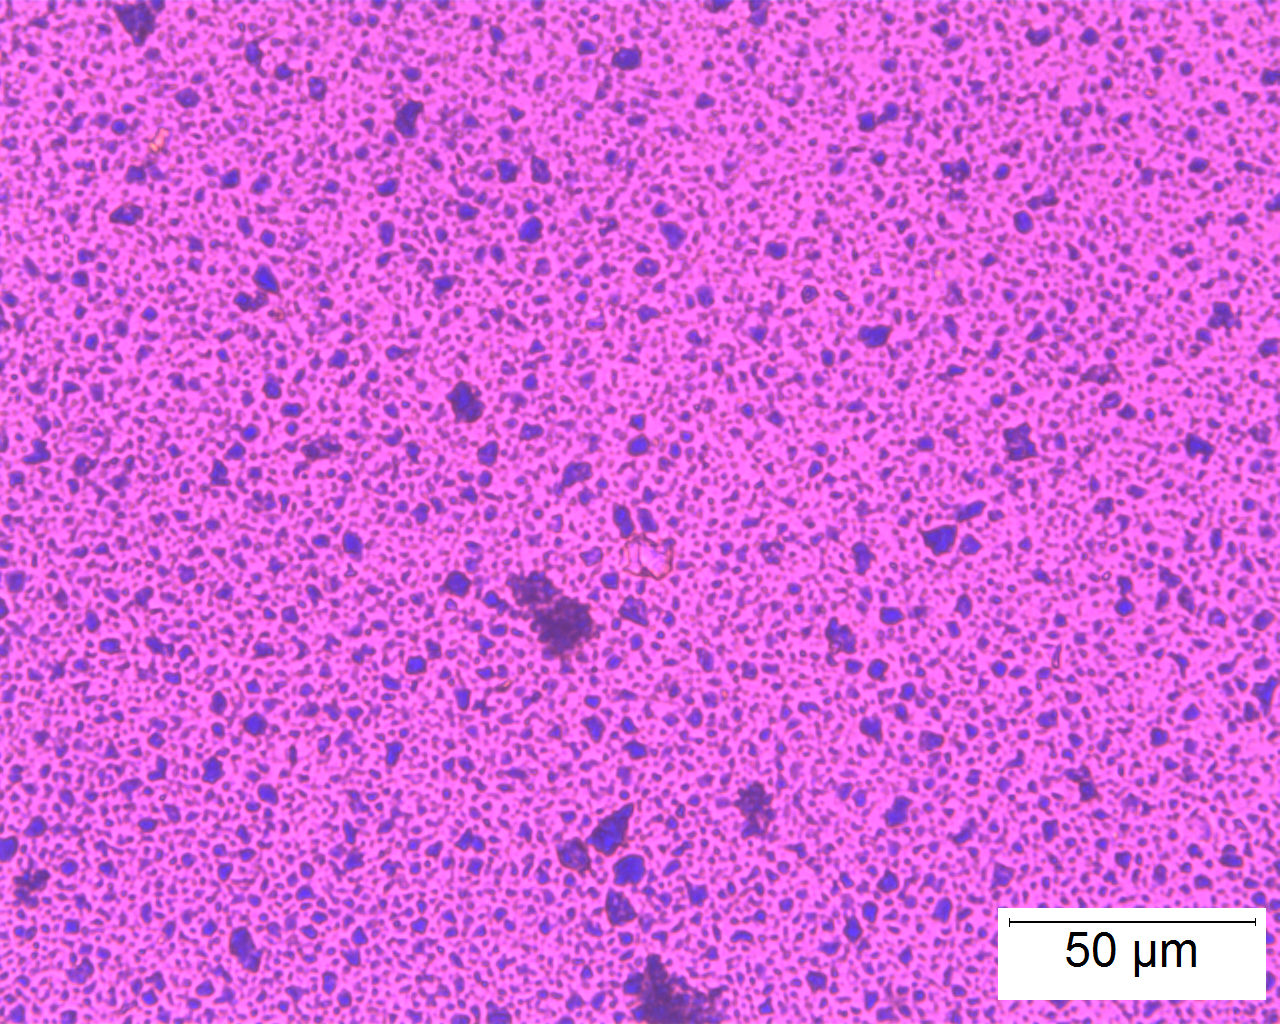
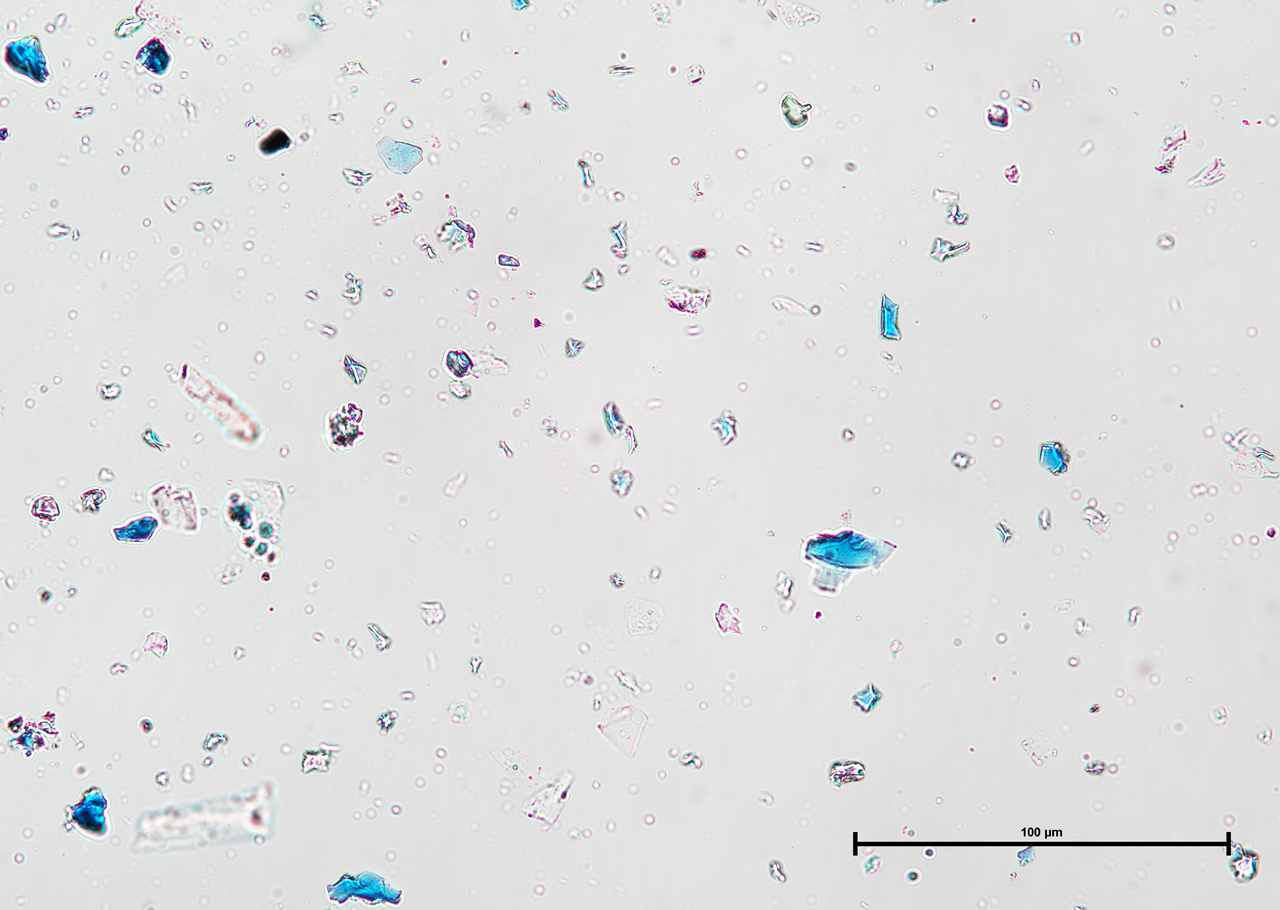
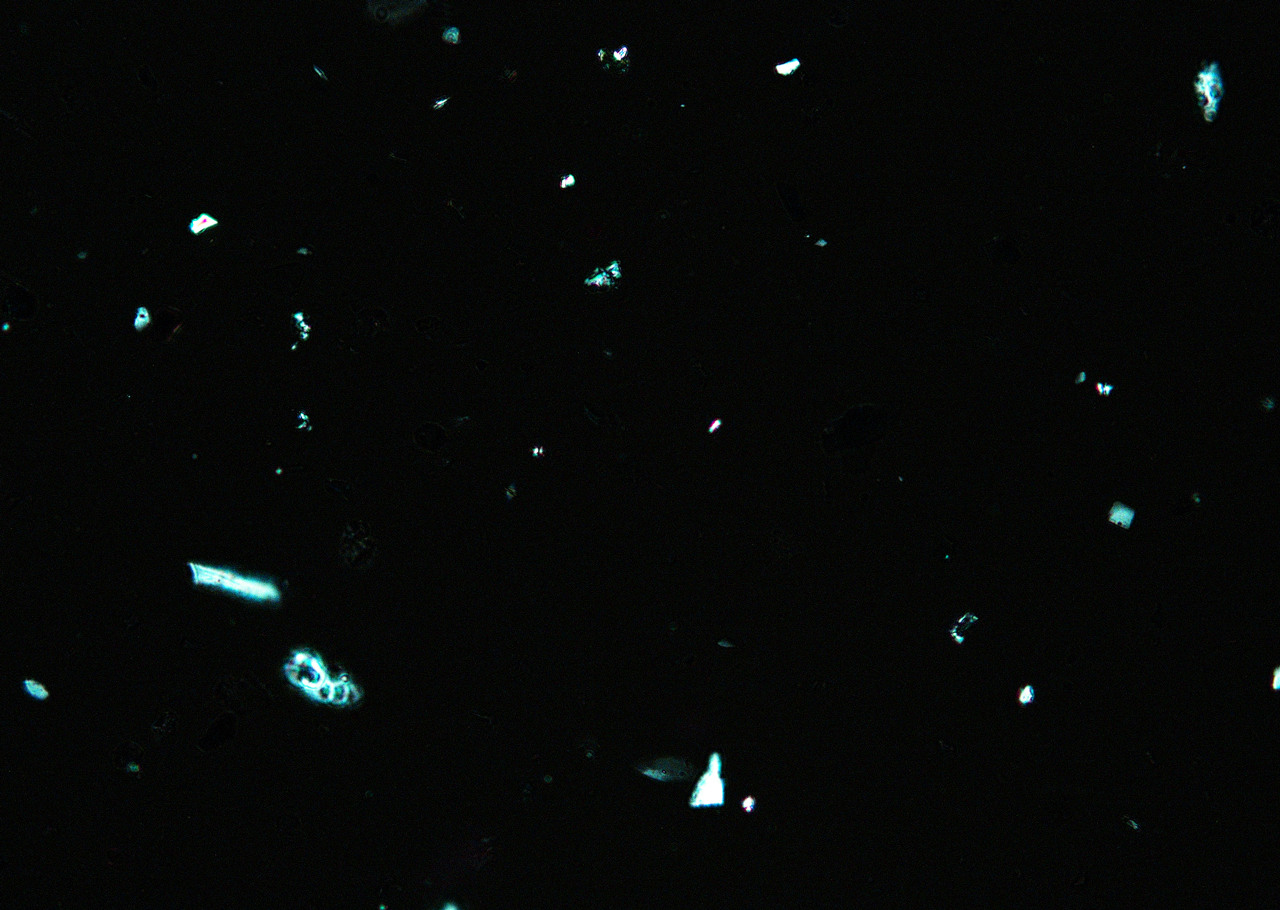
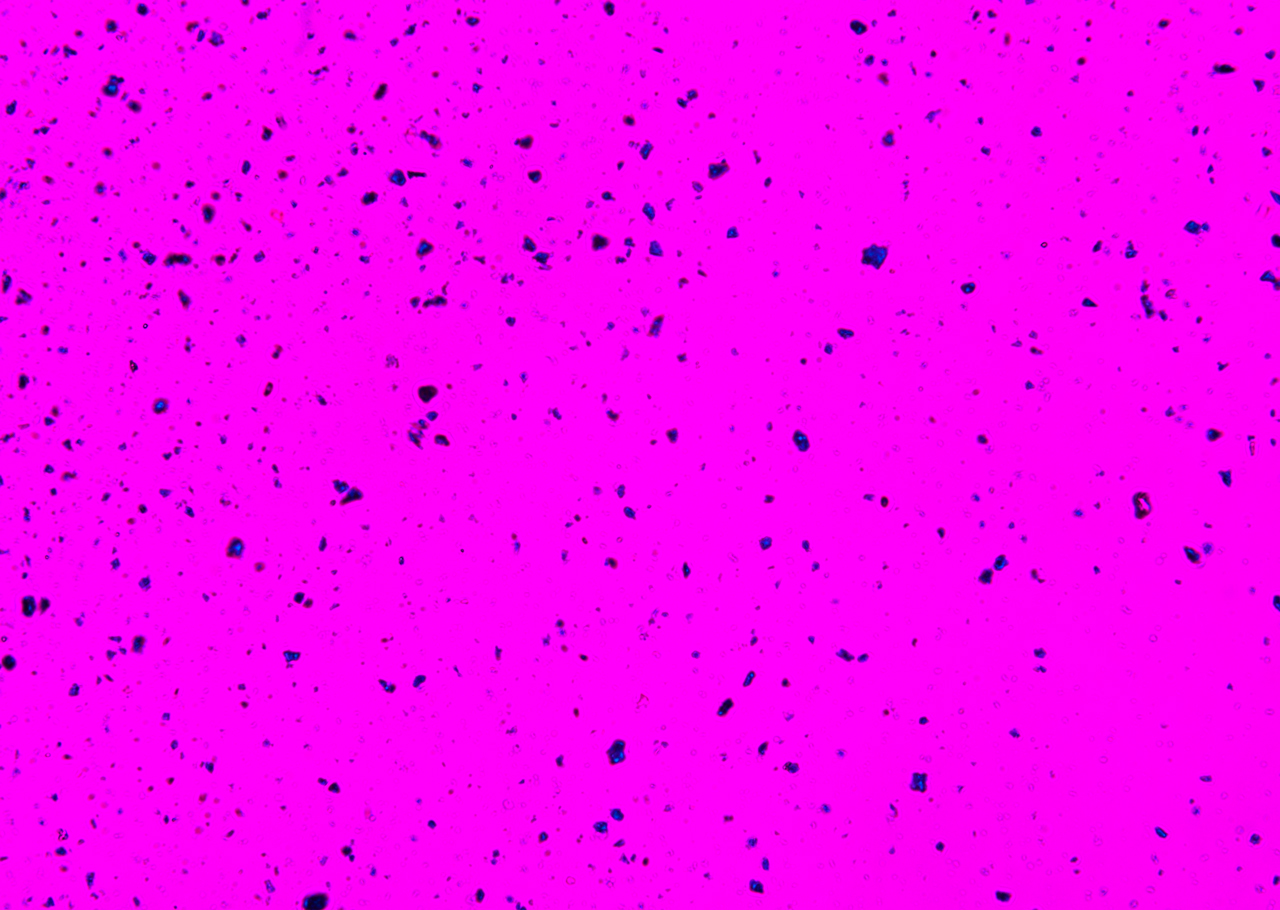
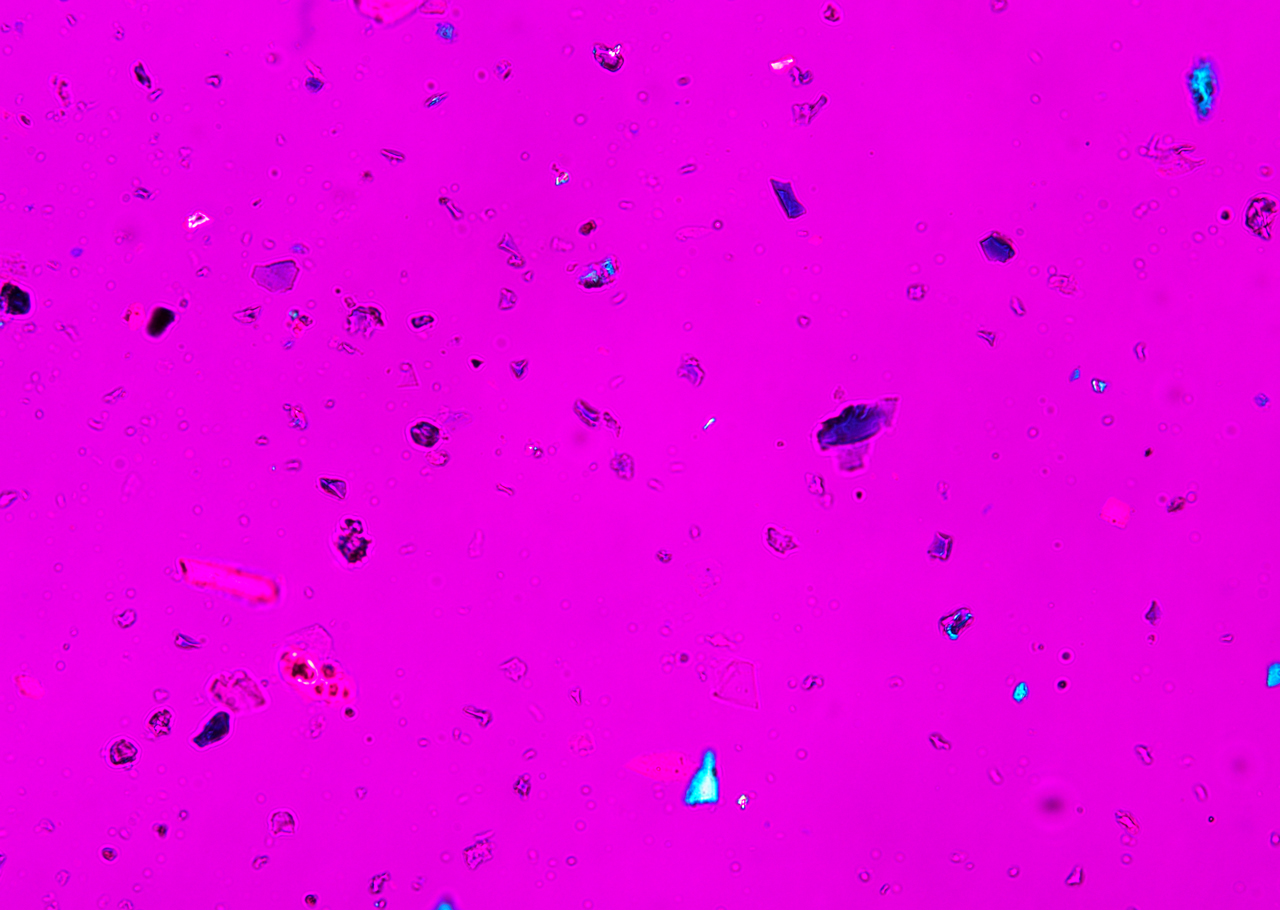
Ultramarine is more uniform in size and color than the Lapis Lazuli. This isotropic pigment with a refractive index of 1.500 occurs often as cubes and dodecahedrons with uneven fracture. Particles are likely to have irregular outlines and uneven surfaces, especially in artificial ultramarine; natural ultramarine is usually more even in outline with smoother surfaces and tends to be fairly tabular; a comparison between synthetic ultramarine and natural ultramarine can be found in images P-106-108. The small individual particles can be quite opaque to transmitted illumination. When transparent particles are medium to deep blue in transmitted light, in reflected light (P-101), they are fairly uniformly deep blue with a slight purplish tinge. Agglomerates (the product of smaller particles forming a new larger particle) are rare, occurring only with the smallest particles of artificial ultramarine. Synthetic ultramarine is stable under all conditions except in the presence of acids; even when subjected to dilute acetic acid, the pigment starts to decompose, lose its color, and evolve to hydrogen sulfide. Synthetic ultramarine is unaffected by the presence of alkalis. The hardness is 5-5.55, and the density is 2.38-2.45.
FLUORESCENCE MICROSCOPY
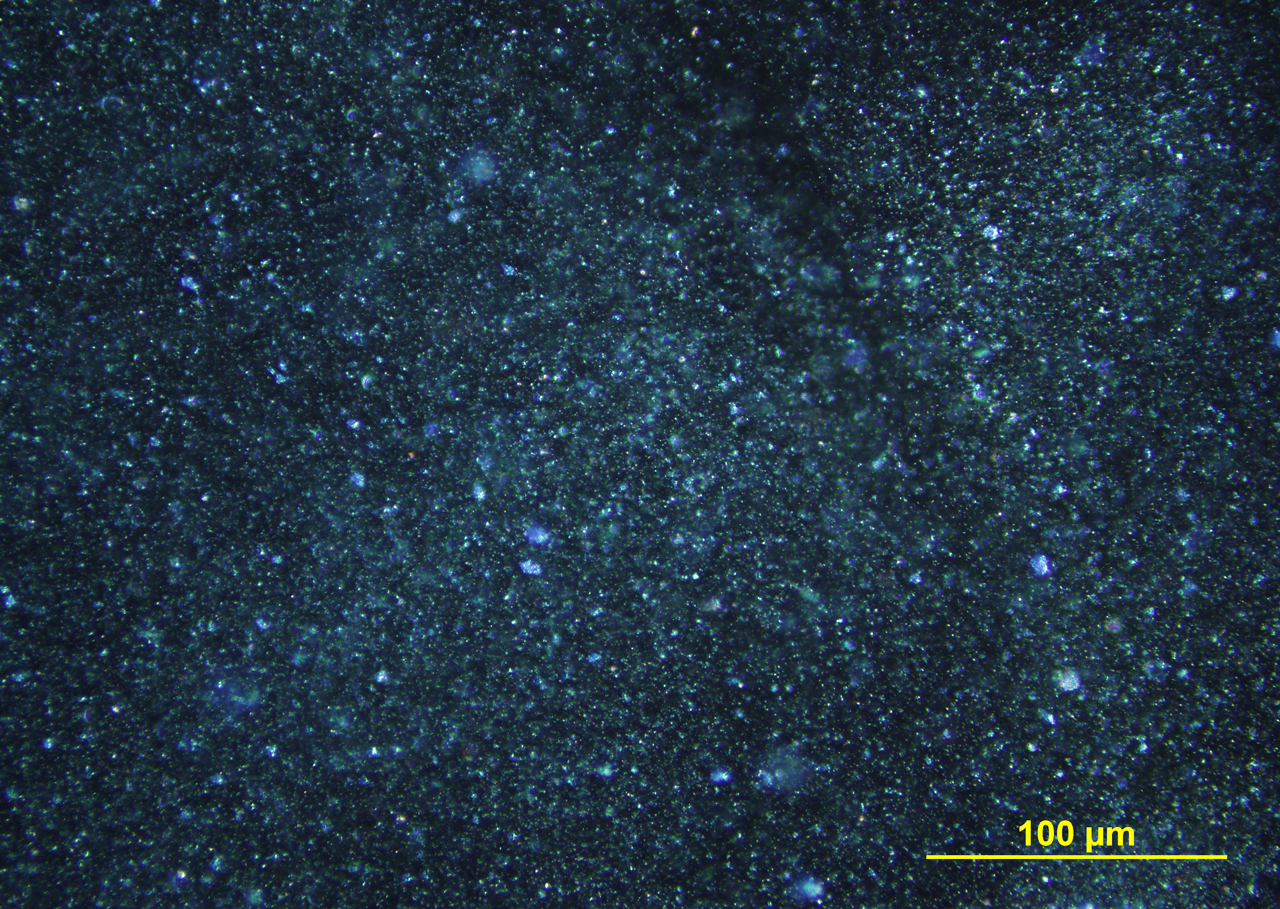
When illuminated with narrow-band 365 nm ultraviolet light, ultramarine blue pigment fluoresces with moderate intensity, showing colors of sky blue and bluish green (photo P-108).
Click on any image to view enlargements.


MICROCHEMICAL TESTS
- Determining the presence of sodium using chloroplatinic acid or uranyl acetate
- The original crystals catalyze the decomposition of NaN3 giving N2S bubbles and decolorizing the blue particles
- HCl decolorizes ultramarine yielding H2S
- Concentrated HNO3 causes slow yellowing
SOLUBILITY TESTS
- Insoluble in water
- Insoluble in 1M HCl
REFERENCES
McCrone, W. C. The Microscopical Identification of Artists’ Pigments. The Particle Atlas; Vol. V.
Ultramarine. McCrone Atlas of Microscope Particles.
Gettens, R. J., Forbes, E. W., Stout, G. L. Painting Materials – A Short Encyclopedia. Van Nostrand: 136, 167. New York, 1947.
McCrone, W. C. Authentication of Paintings. Through the Microscope.
Walter, Dirk. Primary Particles – Agglomerates – Aggregates. Nanomaterials. 9-10.
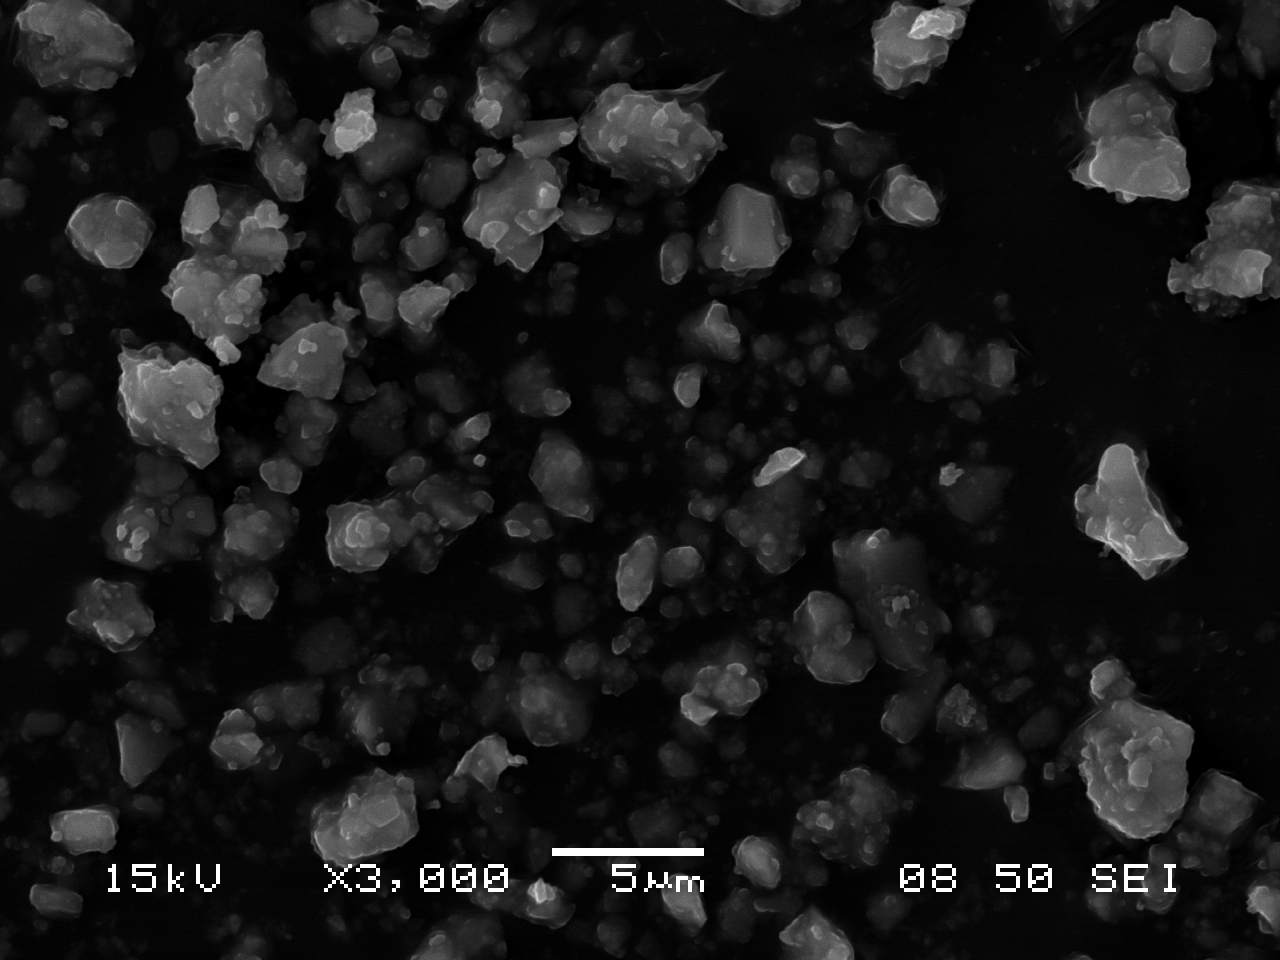
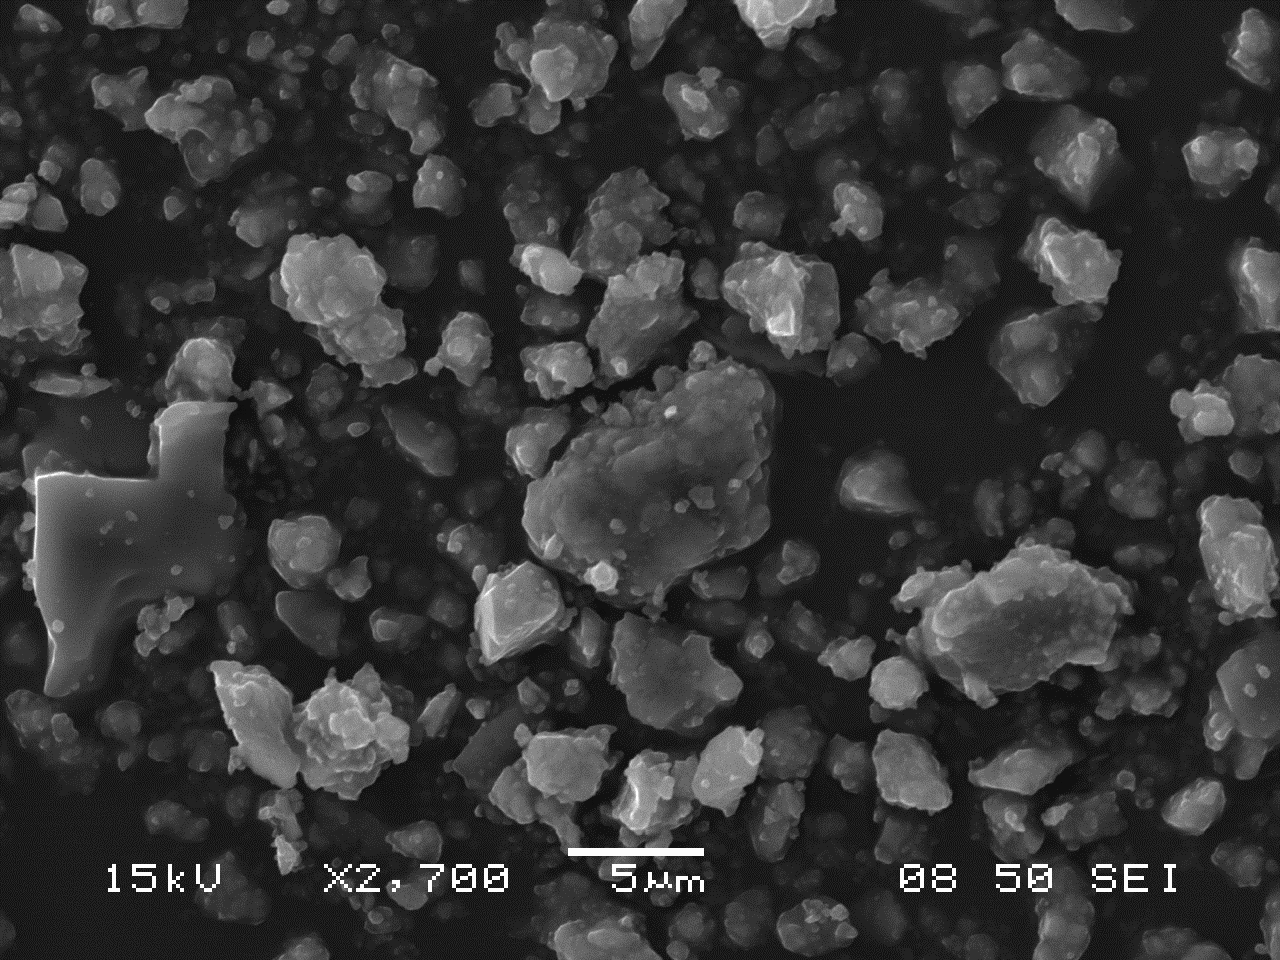
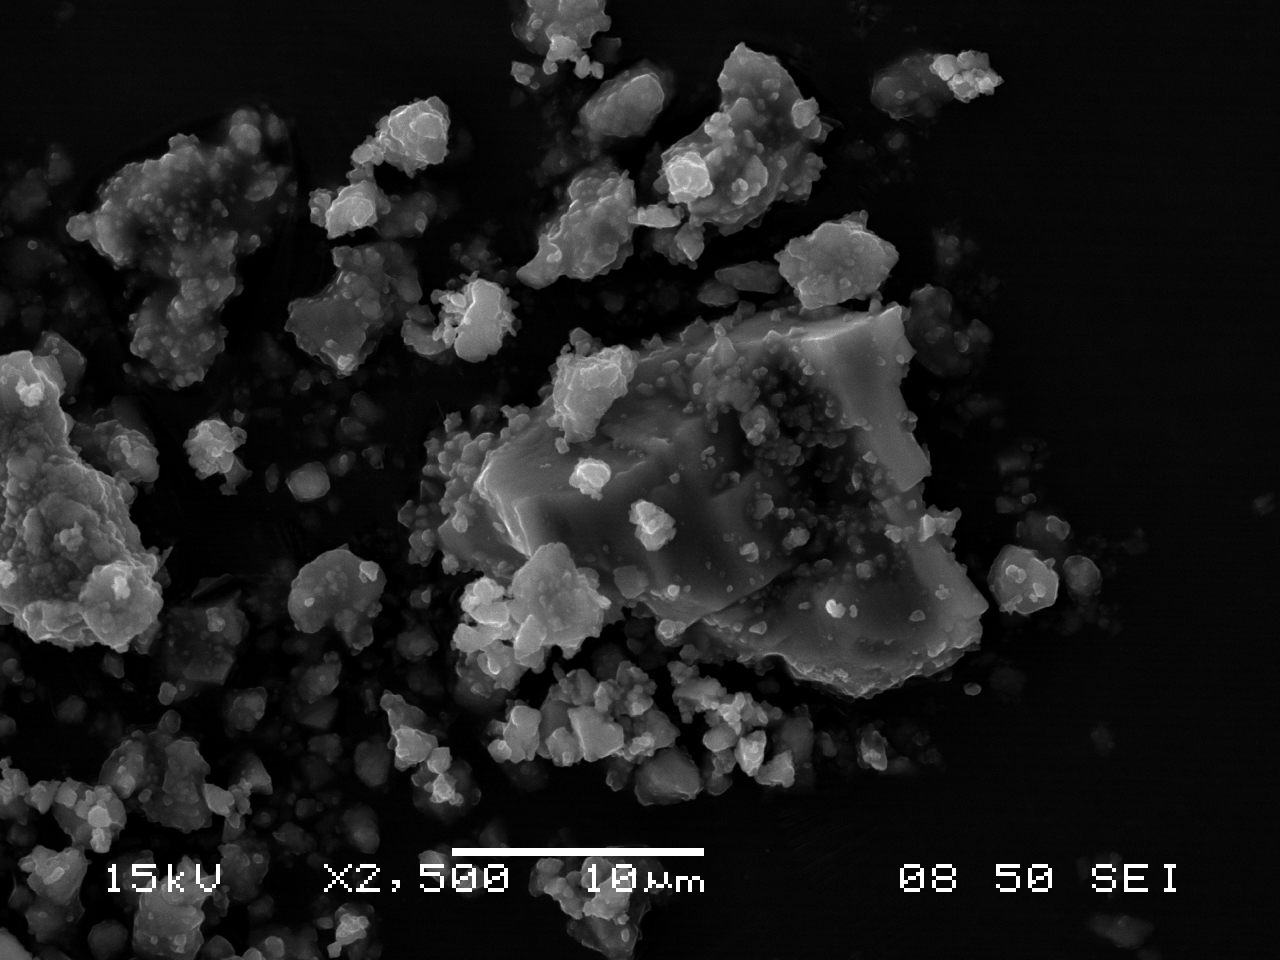
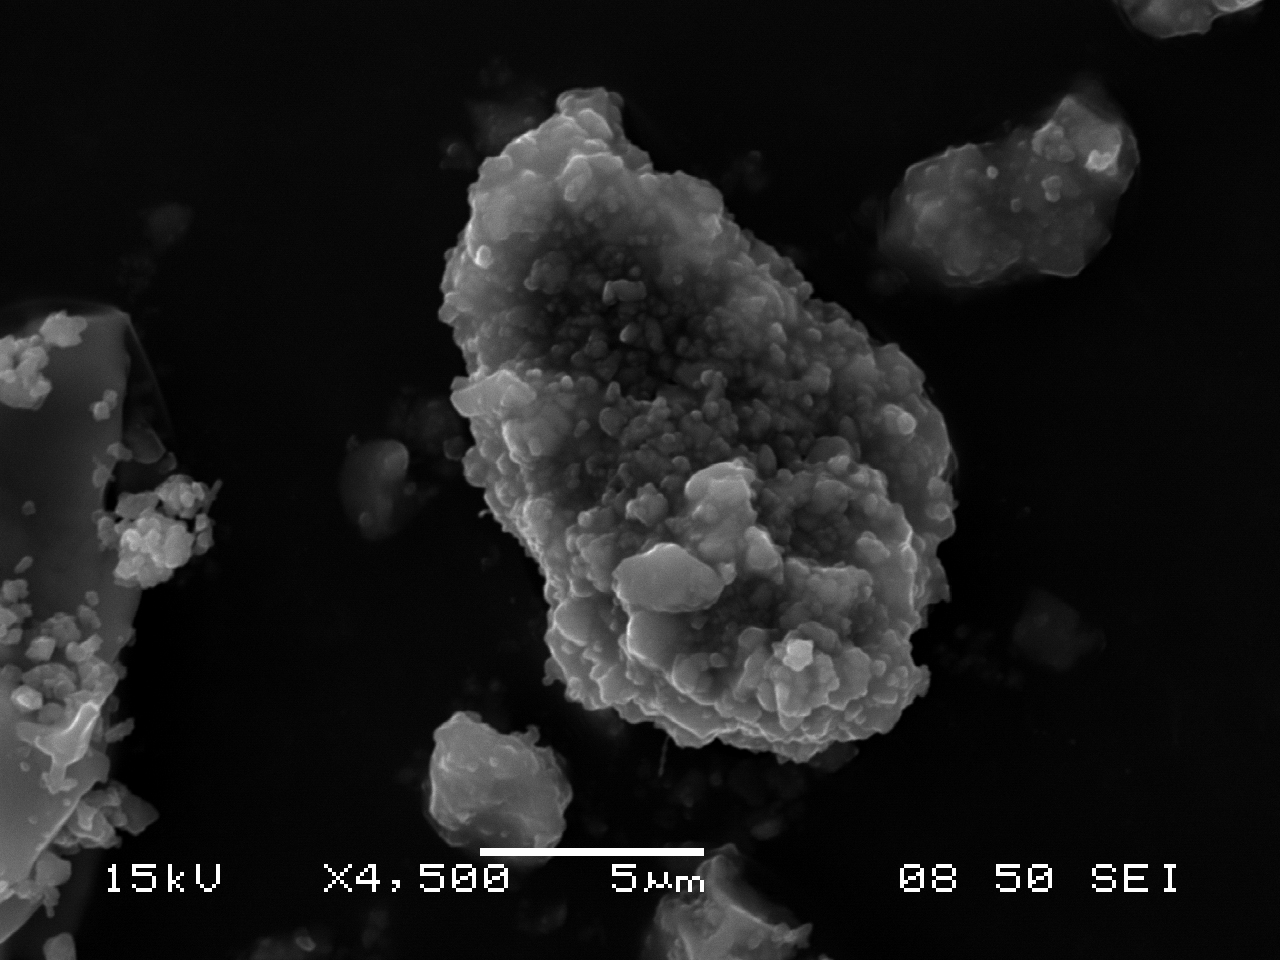
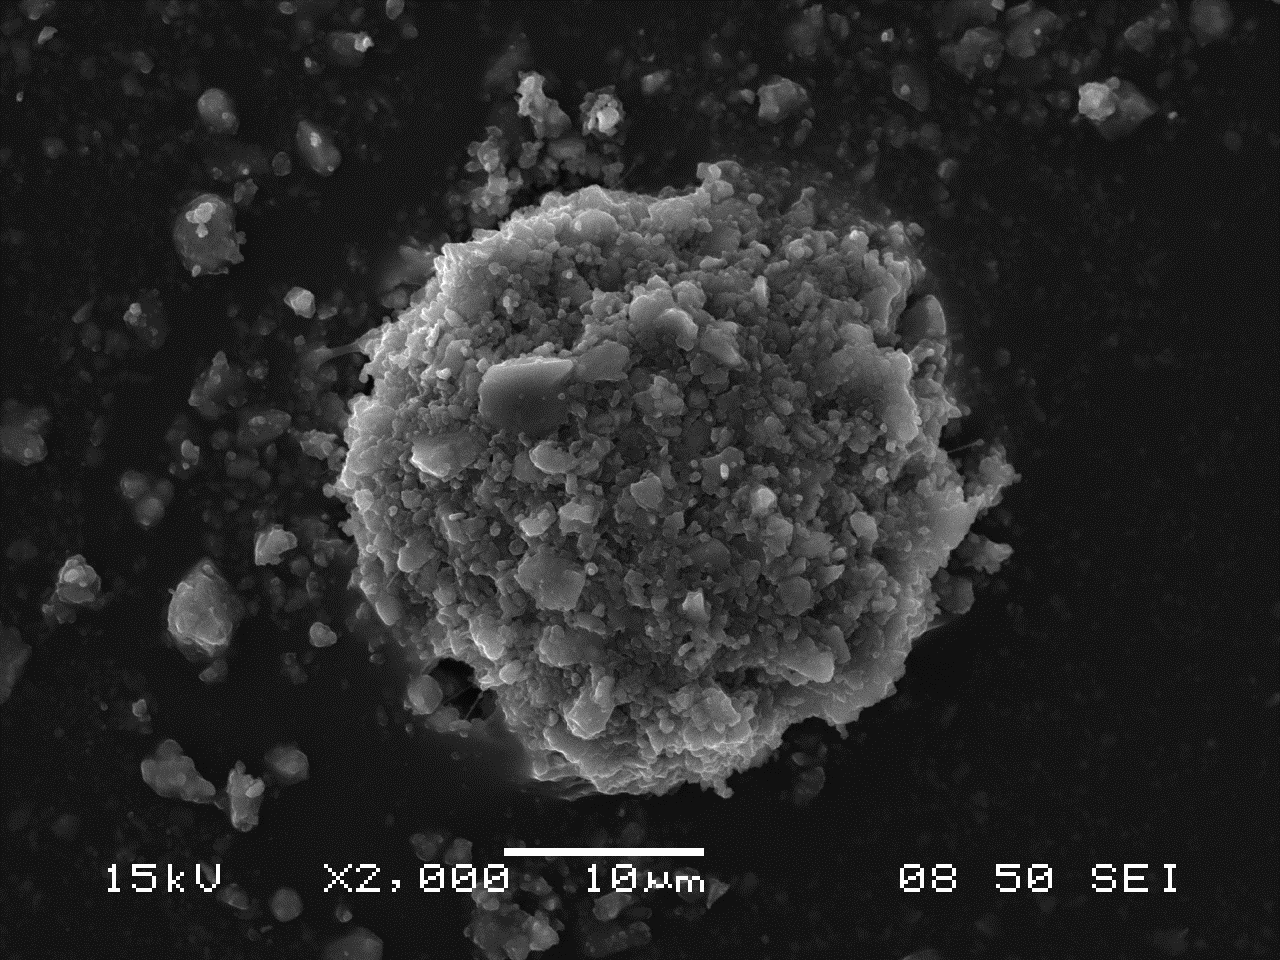
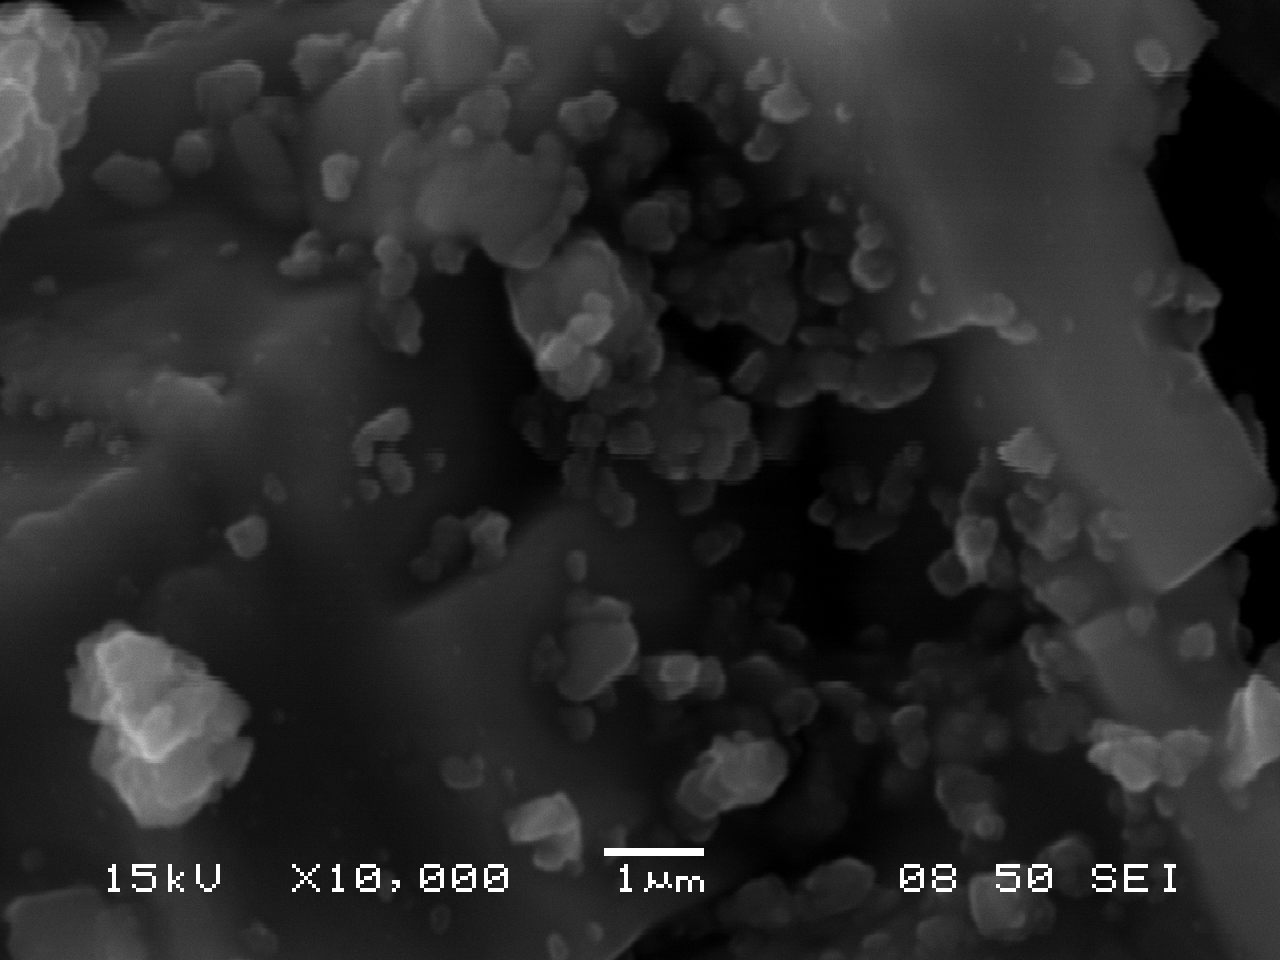
SEM Characterization
The following images of ultramarine pigments were gathered in secondary electron imaging mode using an accelerating voltage of 15kV and a spot size of 50. Small, nearly equant crystals approximately 0.5-1.0 µm across show little tendency to form cohesive aggregates (an assembly of particles were the total specific surface area is less than that of the individual particles), but are present, rather, as loose clusters.
INSTRUMENTATION USED FOR SEM IMAGES
Energy Dispersive X-Ray Spectrometry (EDS)
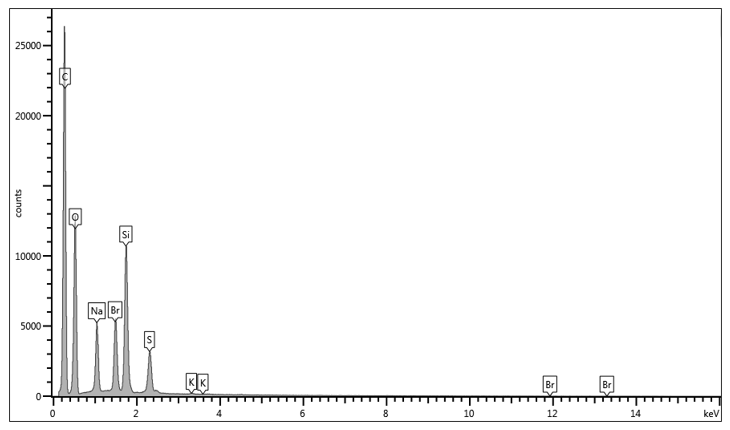
Energy-dispersive x-ray spectrometry was used to determine the elemental composition and distribution of ultramarine blue pigment. Analyses on exterior and interior surfaces of the pigment were performed using an accelerating voltage of 15 kV and a pressure of 30 Pa. The summary table of the elemental weight percentages can be found below.
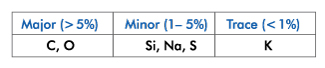
Trace elements may vary depending on impurities in source material.
INSTRUMENTATION USED FOR EDS
- JEOL JCM-6000Plus NeoScope Benchtop SEM
EDS System: Oxford AZTEC v. 3.3
Accelerating Voltage: 15kV
Analysis Range: 1-10kV
Fourier Transform Infrared Spectroscopy
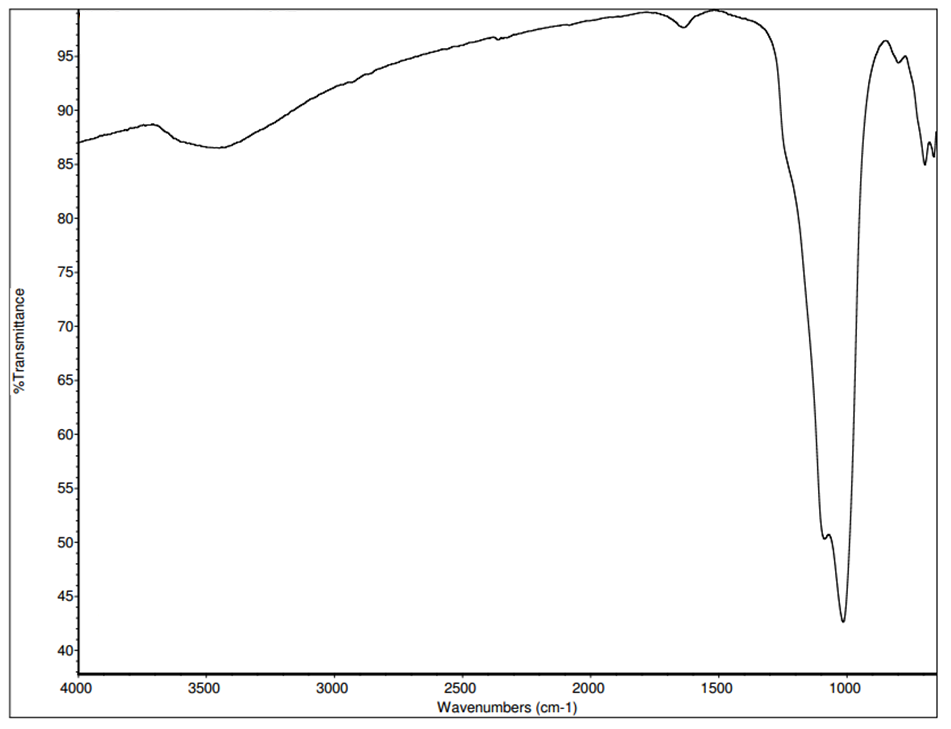
IR spectra of ultramarine pigments are dominated by a strong, broad band in the region of 1090 cm-1 that is due to the stretch of the Si-O-Si bond. The spectrum has less intense bands in the region of 830 cm-1 that may be related to the Si-OH stretch. The weak band in the region of 1640 cm-1 is most likely due to O-H bending. The broad absorption at 3450 cm-1 is due to hydroxyl groups, either from Si-OH groups or from water. Whenever possible, the identification of suspected silicate materials should be confirmed by PLM and elemental analysis.
INSTRUMENTATION USED
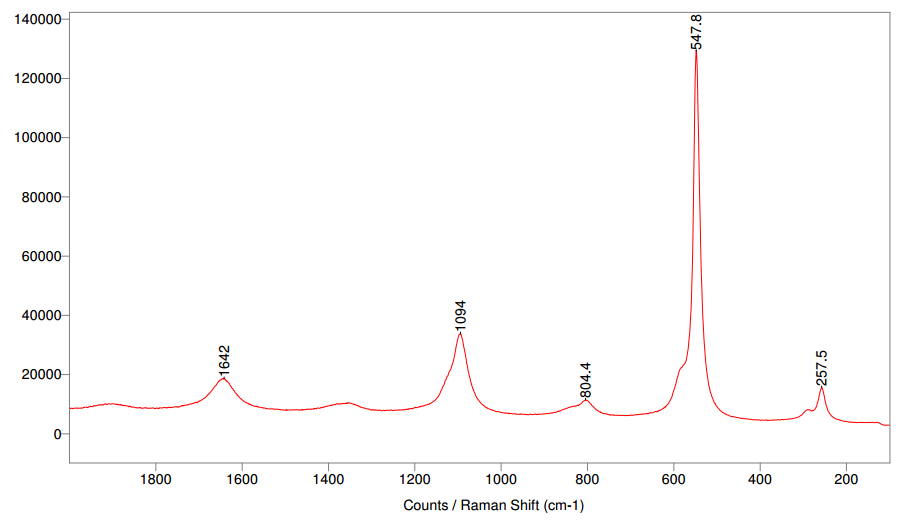
Raman Spectroscopy
Ultramarine blue pigment was analyzed by Raman spectroscopy using 514 nm lasers.
INSTRUMENTATION USED
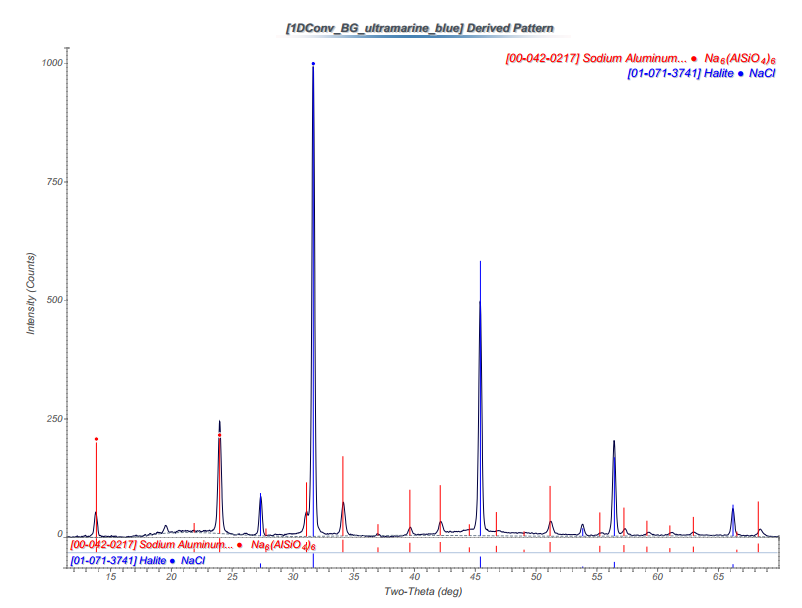
X-Ray Diffraction Characterization
A sample of ultramarine blue pigment was attached to a glass fiber and analyzed using x-ray diffraction (XRD). The powder diffraction pattern was compared to the International Center for Diffraction Data database of diffraction patterns, and two matches were made to sodium aluminum silicon tetra oxygen pattern #00-042-0217 and halite pattern #01-071-3741.
Comments
add comment