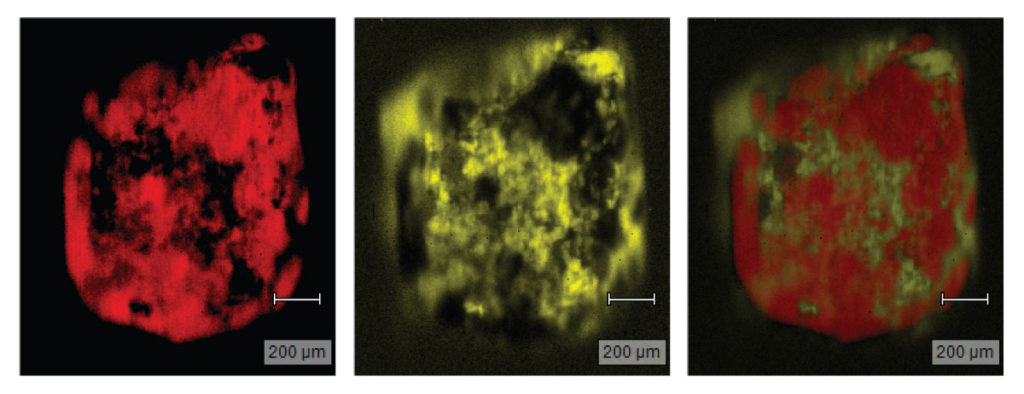
Raman Spectroscopy Mapping as a Tool for Tracking API Morphologies in a Multicomponent Pharmaceutical Product
Tracking a material’s morphology through the production process can be a very powerful analytical method for understanding the structure-property relationship of many different materials, including pharmaceutical components, after they are incorporated into a blend or final product. Here we describe how Raman mapping is used to tackle the problem of identifying morphologies of individual components within a multicomponent system like a tablet or powder. Raman spectroscopy is a phase identification technique that can distinguish between several atomically ordered (i.e. crystalline) and some disordered organic components, whereas other methods provide ambiguous results. Raman mapping can also provide a much clearer understanding than other more common mapping methods, of the evolving morphology of an active pharmaceutical ingredient (API) or other component, as it transitions from intermediate processing steps to the final product.

McCrone Associates is an investigational analysis laboratory that specializes in providing solutions to questions that, without advanced materials characterization instruments, are difficult to answer. One example that we are sometimes faced with is tracking particle morphologies through various processing stages in order to answer a question like: why do these lots react at entirely different rates in our targeted application? Morphological trends can often be related to reactivity or solubility rates because particle sizes and shapes can be strongly correlated with these characteristics. Light microscopy is a vital tool when it comes to evaluating morphologies of single component samples, but what about when the product is made up of several components? Then you must employ a means of segmentation to distinguish between the individual components.
Some of the in-house equipment we have is extremely capable of tracking morphology in one material class, but may fall short in another. This depends on both the physics of the instrument and the multicomponent samples. Segmentation often involves taking spatially correlated measurements from a sample’s surface and then converting these into a two-dimensional image or map. A simple example of segmentation is the backscattered electron imaging mode of a scanning electron microscope (SEM). This measurement can obtain image contrast from the average atomic number of the atoms that reside within the interaction volume of the electron beam. The ensuing image provides a qualitative map of variations in average atomic number. However, what happens if all of the atoms in your multicomponent sample are the same few elements? This poses a problem for techniques that rely on elemental differences for their segmentation and imaging/mapping (e.g. EDS, XRF, XPS, EELS).
This is also a particular challenge for differentiation of organic moieties, as is frequently the case in the pharmaceutical industry, which utilizes many organic materials in carefully designed recipes for producing a final product. Since the API component and the excipients are often made primarily of C-O-H-based materials, it can be very difficult to segment these materials in a useful way. Fortunately, there is an answer, and it is based in Raman spectroscopy!
Raman scattering occurs when photons from a laser interact with a sample in such a manner that scattered photons acquire different energies relative to the laser photon energy. A spectrum is created by examining these energy shifts over a range of energies. Each energy shift corresponds to a chemical bond; the Raman spectrum is a fingerprint that can be correlated to the chemical structure. Nonpolar bonds and functional groups display the strongest Raman scattering effect. Raman is particularly useful for phase identification in crystalline samples. Some common examples are carbon (graphite, diamond, or char), aromatic compounds, APIs, pigments, and some polymers. Organic compounds, such as cellulose, have a weaker Raman spectrum. However, the signal is generally strong enough relative to background that it can be used for mapping.
We often turn to phase identification in lieu of elemental identification, but there aren’t very many instruments that are capable of phase mapping, especially of crystalline, organic substances. Component spectra fitting is a method that can produce individual component maps of organic substances based on their Raman spectra, or material phase. For this reason, maps based on this technique can be utilized to probe the morphologies of the individual components that make up an agglomerated particle or tablet. Therefore, if you want to better visualize the morphology of your API in your final product, or track its evolution throughout production, then Raman mapping can be a powerful analytical option. We have recently been improving our Raman Spectroscopy mapping capabilities. Let us know if you have a sample that might benefit from this analytical method.
Comments
add comment