Using XRD and SEM/EDS to Identify the Phases Present in Mount St. Helens Ash
The composition of three ash samples that were obtained from the 1980 Mount St. Helens eruption will be investigated. These samples were collected from distances of 5 and 250 miles from the volcano, and were numbered Samples 1 and 3, respectively. This article will demonstrate how elemental analysis and X-ray diffraction can be used together to filter a large crystallographic database to find out which crystalline phases are present in the samples.
The first step to take when approaching this type of problem is to figure out which elements are present in the powder. Later on, this will help us narrow down the suggestions provided by the crystallography database.
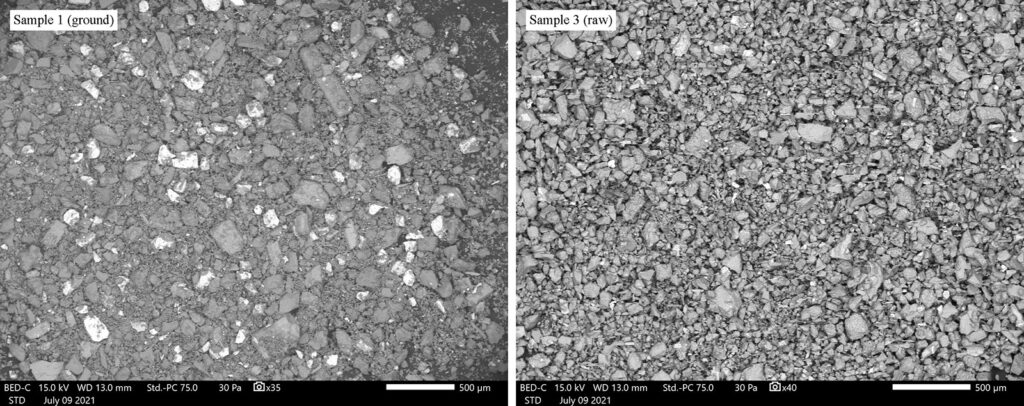
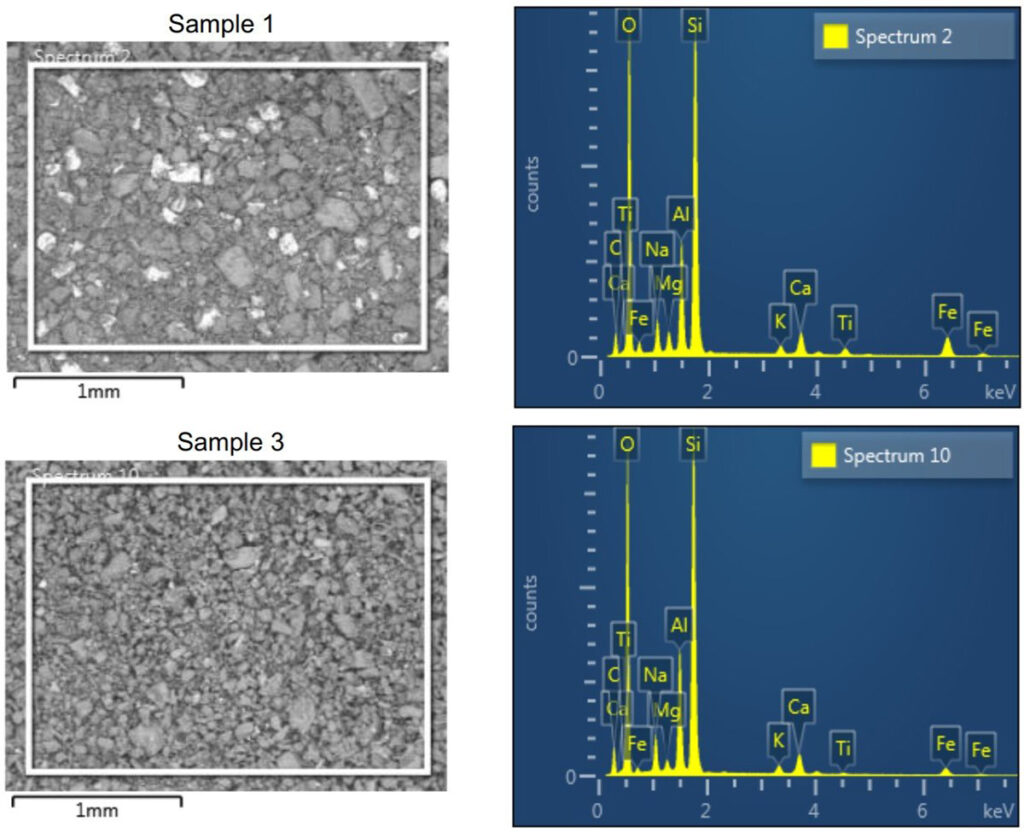
At McCrone Associates we utilize scanning electron microscopy with energy dispersive spectrometry (SEM/EDS) for our elemental analyses. The powder was spread onto a smooth carbon tab in a compact mound, and EDS spectra were collected from different regions of the powder. This provides the composition of the powder overall, and the backscattered electron images will also reveal heterogeneity between powder particles, if present (Figures 1 and 2).
Since the samples were expected to be heterogeneous, each sample was ground up into a fine powder using a mortar and pestle. This serves to both homogenize the powder and to reduce the particle sizes so that they can be packed into the glass capillaries that hold our powder samples. These capillaries have inner diameters of approximately 100 to 300 µm.
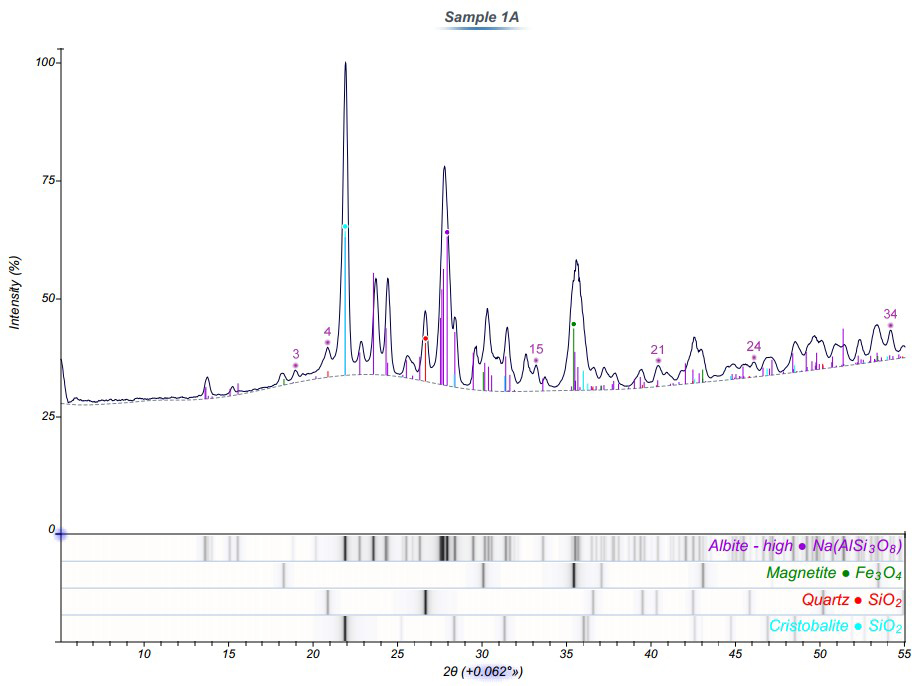
We have two transmission micro X-ray diffractometers in which the capillary holding the powder is rotated continuously throughout the data collection process (15 min). Since the sample volume analyzed was very small, diffraction patterns were collected in triplicate from three different regions of the same capillary. The 2D images were then integrated and converted into standard 2θ versus intensity plots. The background signal was not subtracted from the diffraction patterns.
Indexed diffraction patterns from two of the specimens are displayed in Figures 3 and 4. The ribbon below each plot contains the list of indexed phases. The corresponding stick diagram was also overlaid on the plot (color coded by phase) to demonstrate the consistency between the reference and experimental diffraction patterns.
Performing a database search may sound like a trivial task, but when the database contains over one million potential matches, the complexity increases somewhat. Narrowing the search field is essential to ensuring that the correct matches are found.
The best way to do this for inorganic materials is by applying a suitable element filter based on the EDS spectra. However, care must be taken not to exclude valid phases unintentionally. One example of this is forgetting to include elements in the list that EDS detectors cannot detect: namely, hydrogen.
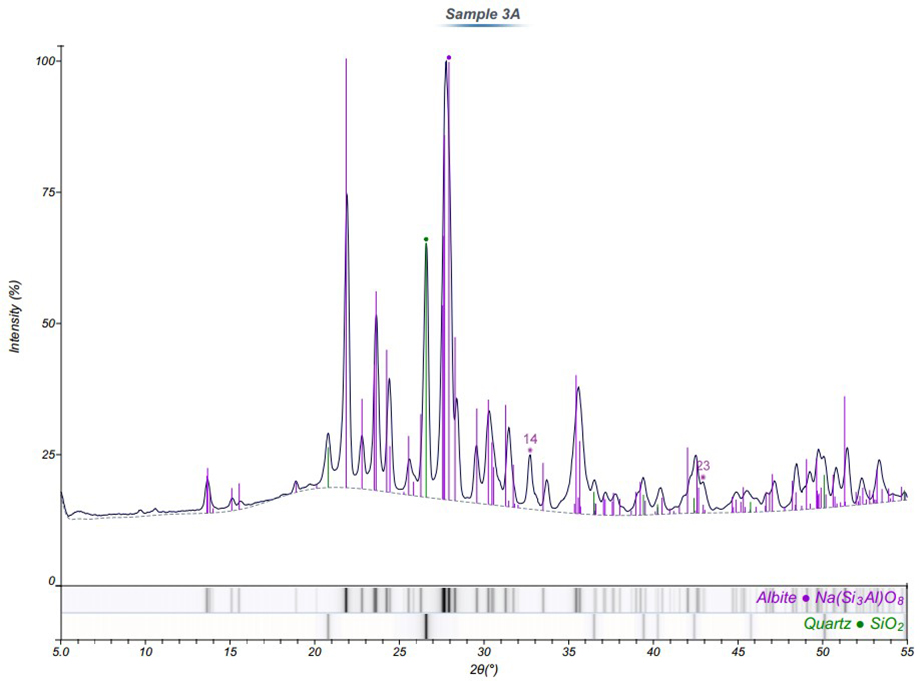
In the samples closest to the volcano, four primary phases were identified including Albite, Magnetite, Quartz, and Cristobalite. Further away from the volcano, only two crystalline components were detected (Albite and Quartz). Therefore, the Fe-rich material observed in the SEM images and EDS spectra of Sample 1 is likely magnetite.
In summary, two complementary techniques were used to identify the crystalline phases present in ash collected from the Mount Saint Helens eruption. To determine crystalline phases in a powder, the best approach is to use X-ray diffraction. However, because the reference database is so large it is helpful to use a complementary technique to find the composition of the powder and any heterogeneity that might cause confusion in the diffraction patterns.
Contact us to learn more about how we can collaboratively assist with your particle identification needs.
Comments
add comment